Lesson 02 — Record and Read the Data
Learners carry out the fair test they planned, observe carefully, and record what happened using a simple table of marks or drawings. Then they read the table back and describe — in their own words — what the data show, learning that data are evidence, and evidence is what really happened, not what they hoped.
Objectives
Objectives
- D06.S1.03.02 Record observations using drawings, words, or simple tables, and describe what the data show.
- D06.S1.03.01 Plan and carry out a simple fair test by changing one thing and keeping the rest the same.
Essential question
How do I record what I observe and describe what the data show?
Key vocabulary
Materials
Standard materials
- The fair test planned in Lesson 1 · 1 The ramp test, or a fresh one everyone can run — e.g. a stone on smooth versus rough ground
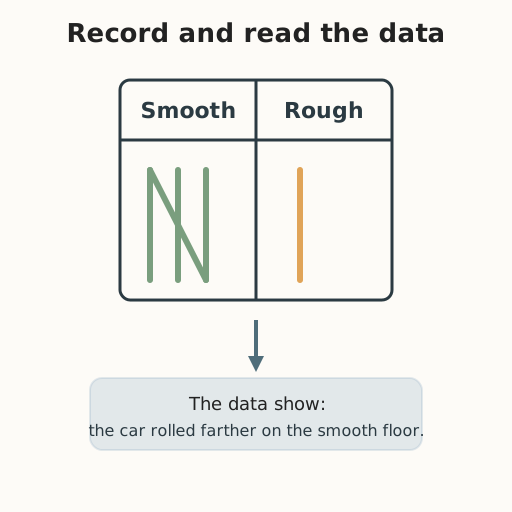
- A simple data table per learner · per learner Two columns — "Smooth" and "Rough" — with room for three tally or tick marks each
- Pencils and crayons · per learner
Low-tech / no-cost
- Marks in the dirt or on paper Make tick marks for each roll or slide — a tally made with a stick or pencil
- Voice and a partner Take turns telling what happened — "It rolled farther on the smooth floor"
Enriched / lab & device
- A meter stick or tape measure · 1 To measure and write distances in numbers as well as tally marks
- A class results chart · 1 A big table to gather everyone's smooth-versus-rough results together
Works in different contexts
- large-group Run the test together and fill the class chart, then pairs run their own trial and record their own table
- self-directed A learner runs the test alone, marks each result in a table, and writes or draws one sentence about what the data show
- outdoor-only Slide a stone on smooth rock and rough sand three times each, tally the results in the dirt, and describe what you saw
- multi-age Older learners act as record keepers, writing down what younger partners observe and helping them read the table back
- level-grouped Learners who can compare runs describe a pattern across the three tries; learners still learning report just "farther / not farther"
Lesson 2 — Record and Read the Data
Summary
The fair test planned in Lesson 1 is now carried out. Learners observe carefully, record what happens using a simple table of marks, drawings, or words, and then read the table back to describe what the data show. They meet the scientist’s honesty: data are evidence — what really happened — and describing the data is telling the truth about it, whether or not it matched the prediction.
Objectives
- Record observations using drawings, words, or simple tables, and describe what the data show. (D06.S1.03.02)
- Plan and carry out a simple fair test by changing one thing and keeping the rest the same. (D06.S1.03.01)
Connection
You rolled the car three times on the smooth floor and three times on the rough mat. If you do not write it down, you will only half-remember it. A scientist records — she makes a little table with two columns and puts a tick mark each time. At the end she looks at the marks and says what the data show: “The car rolled farther on the smooth floor every time.” That is how a guess becomes something you can trust: you wrote down what really happened.
Materials
- The fair test planned in Lesson 1 (or a fresh one everyone can run)
- A simple data table per learner
- Pencils and crayons
Preparation
- Set up the test so everyone can see it and, where possible, run a trial themselves.
- Prepare the data table with two columns (“Smooth” / “Rough”) and room for three marks each.
- Have a class results chart ready if you will gather results together.
Facilitator note
This lesson is written to the learner (“you”). The heart of it is the link between observing, recording, and describing: recording turns a blurry memory into data, and describing the data is where the learning lives. Model the table once (worked example) — put a tick in the right column, then read it back in a sentence — then guide pairs, then let learners record alone. Build in retrieval: begin by asking learners to recall their plan and prediction from Lesson 1. Keep the scientist’s honesty front and center: if the result did not match the prediction, the data still win, and that is a discovery, not a defeat. A table need not be fancy — marks in dirt, tally lines, drawings, or words all count as recording. Repeating the trial three times is a first, gentle step toward “why we test more than once” (spaced for Grade 4).
Procedure
- Gather and remember (5 min). Yesterday you planned a fair test. Say it again: what is the one thing you change, and what do you keep the same? What did you predict?
- Carry out the test (15 min). Do the test. Roll the car three times on the smooth floor and three times on the rough mat. Observe closely: what happens each time?
- Record the data (15 min). On your table, put a tick mark (or a drawing) each time. Where did it roll farther? Mark it. Your marks are your data — what really happened.
- Read the data (10 min). Look at your table. What do the data show? Say it in your own words: “It rolled farther on smooth every time.” “The smooth floor let it roll farther.” Write or draw one sentence.
- Share and close (5 min). Tell a partner what your data show. Did it match your prediction? Whether it did or not, you now know something true — because you recorded it.
Differentiation
- Support: Record together on the class chart; the learner points to the column with more marks and says one thing the data show.
- Support (non-speaking): Make the marks or point to a drawn picture of the result; a partner says the sentence aloud.
- Support (blind/low-vision): Use a test you can hear or feel (a bell, a sliding block) and tally with objects or raised marks, then describe by telling.
- Support (motor): Direct a partner to run each trial while you call out where each mark goes, then read the table back aloud.
- Extension: Record the distances in numbers with a meter stick, and say which number is bigger and what that means.
Assessment
- Formative (observation): Can the learner record at least one mark per trial and describe in their own words what the data show?
- Self: The learner checks their table: “Did I mark every try?”
- Artifact (portfolio): The completed data table with the learner’s one-sentence description.
Home connection
At home, make a tiny table of something you do three times — how many times you can hop, or which of two spoons sinks. Record the marks and tell a grown-up what your data show.
Resources
- BBC Bitesize (KS2 Science), “Recording and presenting scientific data” — using tables, tally marks, and drawings to record and read results. https://www.bbc.co.uk/bitesize/topics/zqkk7ty/articles/zdwttrd