Lesson 08 — Proportional Relationships in Tables and Graphs
Learners recognize a proportional relationship by two tests: the ratio y/x is the same in every row of a table, and the graph is a straight line through the origin. They classify tables and graphs as proportional or not, and name the constant of proportionality.
Objectives
Objectives
- D05.S2.07.02 Identify proportional relationships in tables, graphs, and equations, and express them in the form y = kx.
Essential question
How do I recognize a proportional relationship in a table and a graph?
Key vocabulary
Materials
Standard materials
- Table and graph pages · 1 per learner Blank coordinate grids and tables to record pairs of quantities
- Proportional vs. not cards · 1 set per pair Tables and graphs to classify as proportional or not, with reasons
- Counters · per pair To build equal groups and record the growing pairs
Low-tech / no-cost
- A ground grid and stones Draw a coordinate grid on the ground; place a stone at each (x, y) pair and check for a straight line
- Voice and body Chant the equal ratio ("1, 2, 3 ... and 2, 4, 6") to feel the constant multiplier
Enriched / lab & device
- A table-and-graph match game · 1 per group Cards pairing a table, a graph, and a "proportional / not proportional" label, for repeated play
- A graphing tool · 1 per group To plot pairs and see which form a straight line through the origin, where devices allow
Works in different contexts
- large-group Plot one proportional table together, then have pairs classify cards and check each other's reasons
- multi-age Younger learners build equal groups with counters while older learners record the table and plot the points
- self-directed A learner works the table and graph pages alone, plotting and classifying against the worked examples
- level-grouped Learners ready to extend find the constant of proportionality from a table or graph and write it
- outdoor-only Use a ground grid and stones to plot pairs; check whether the points line up through the origin
Lesson 8 — Proportional Relationships in Tables and Graphs
Summary
Learners recognize a proportional relationship by two tests: the ratio y/x is the same in every row of a table, and the graph is a straight line through the origin. They classify tables and graphs as proportional or not, and name the constant of proportionality.
Objectives
- Identify a proportional relationship in a table and a graph, and explain how you know. (D05.S2.07.02)
Connection
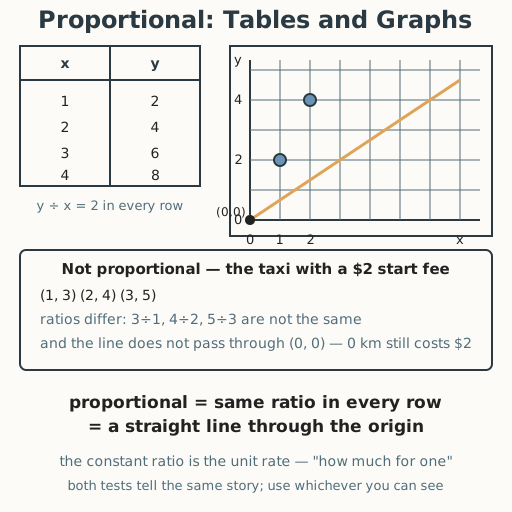
A shop sells apples at $2 each: 1 apple costs $2, 2 cost $4, 3 cost $6, 4 cost $8. In the table, every row gives the same ratio — price ÷ apples = 2. On a graph, the points (1, 2), (2, 4), (3, 6), (4, 8) all lie on one straight line that passes through (0, 0) — zero apples cost zero dollars. That straight-line-through-the-origin shape is the picture of a fixed price, a fixed speed, a fixed dose. Wherever one quantity grows in lock-step with another, people everywhere read the same two signs: a constant ratio and a straight line from nothing.
Materials
- Table and graph pages
- Proportional vs. not cards
- Counters
Preparation
- Copy table and graph pages and the classify cards.
- Have worked examples ready: (1,2), (2,4), (3,6), (4,8) → proportional (ratio 2); (1,3), (2,5), (3,7) → not proportional.
- Recall from Lesson 1 and Lesson 3: unit rates and constant of proportionality.
Facilitator note
This lesson is written to the learner (“you”). The ideas to land: (1) in a proportional
relationship, the ratio y/x is the same in every row of a table (the constant of
proportionality); (2) its graph is a straight line through the origin; and (3) either test
can classify a relationship, but both tell the same story. Because recognizing proportionality is
a foundational skill, use explicit instruction, worked examples, and guided practice before
independent work (Kirschner, Sweller & Clark, 2006). Watch for the slip of calling any straight
line “proportional” — it must also pass through the origin, and of checking only one row’s ratio
instead of every row. Retrieval: ask learners to recall unit rates (Lesson 1) — the constant of
proportionality is the unit rate. The global lens: the coordinate grid and straight-line
reasoning build on ideas recorded by many traditions — for example, the Persian scholar Omar
Khayyam used geometric methods for equations, and graphs grew from coordinate ideas across
cultures; reading a line through the origin is a shared human tool. The egalitarian lens
(docs/philosophy.md §4): the two tests are simple enough that anyone can check a price or a
rate for fairness — no special status needed.
Procedure
- Gather (5 min). You know a unit rate is “how much for one.” Today you learn to see that same rate in a table and on a graph.
- Meet the table test (10 min). In a proportional relationship, the ratio y ÷ x is the same in every row. For apples: 2÷1 = 2, 4÷2 = 2, 6÷3 = 2, 8÷4 = 2. That constant 2 is the constant of proportionality — the price per apple.
- Meet the graph test (10 min). Plot the pairs (1, 2), (2, 4), (3, 6), (4, 8). They form a straight line that passes through (0, 0). Zero of one quantity gives zero of the other. Straight line through the origin = proportional.
- Worked example — not proportional (10 min). A taxi charges a $2 flag-fall plus $1 per kilometre: (1, 3), (2, 4), (3, 5). The ratios 3÷1, 4÷2, 5÷3 are different, and the graph is a line that does not pass through the origin (0 km costs $2). So it is not proportional — it is linear with a starting amount.
- Practice with a partner (10 min). Take your classify cards. For each, test the ratio in every row and check the graph for a straight line through the origin, then label it and give your reason. Trade and check each other.
- Close (5 min). Proportional = same ratio in every row = straight line through the origin. Both tests say the same thing; use whichever you can see.
Differentiation
- Support: Use only whole-number pairs and plot them with counters on a large grid; describe each step aloud so learners with low vision can follow by listening.
- Extension: Given a table or graph, find the constant of proportionality and write a sentence describing the relationship (e.g., “$2 per apple”).
Assessment
- Formative (observation/self): Can the learner classify a table and a graph as proportional or not, and justify with the constant ratio and the straight-line-through-the-origin tests?
- Self-check: The learner asks, “Is the ratio y÷x the same in every row? Does the graph go straight through (0, 0)? Do both tests agree, and can I name the constant of proportionality?”
Home connection
At home, record two real quantities that grow together (items and total cost, time and distance, people and food) in a small table, and check whether the ratio stays the same — then say whether it is proportional.
Resources
- Proportional relationships in tables and graphs are standard in middle-grades mathematics; see
John A. Van de Walle, Elementary and Middle School Mathematics (10th ed., 2019). The note that
coordinate and straight-line methods have roots in many traditions (e.g., Omar Khayyam’s
geometric methods for equations; MacTutor, “Omar Khayyam,” S-296) is a historical observation;
treating all traditions as worthy is a value (
docs/philosophy.md§4). The claim that simple fairness checks should be open to all is a value commitment.