Lesson 11 — Scale Drawings
Learners read and make scale drawings, using a scale ratio to convert between drawing lengths and actual lengths. They find actual lengths from a map or plan, reproduce a drawing at a given scale factor, and explain what the scale means.
Objectives
Objectives
- D05.S3.07.02 Solve problems with scale drawings and circles, using the relationship between circumference and diameter.
Essential question
How does a scale drawing represent a real object, and how do I find real lengths from it?
Key vocabulary
Materials
Standard materials
- Grid paper and rulers · per learner To make and read scale drawings on a square grid
- Scale problem cards · 1 set per pair Real situations (a map, a floor plan, a model) to convert between drawing and actual lengths
- A printed map or floor plan · 1 per pair Where available, a real map with a scale bar to read
Low-tech / no-cost
- A ground map and paces Draw a room or field on the ground at a stated scale; pace out the actual lengths and check
- Voice and body Say the scale aloud ("1 cm on the page is 100 cm in real life") and act out a scaled stride
Enriched / lab & device
- A scale-match game · 1 per group Cards pairing a scale drawing with its scale and an actual length, for repeated play
- A mapping or design tool · 1 per group A tool to make a scale drawing and read distances, where devices allow
Works in different contexts
- large-group Read one map scale together, then have pairs work problem cards and check each other's conversions
- multi-age Younger learners count grid squares while older learners multiply by the scale factor
- self-directed A learner works the problem cards alone, converting with the scale factor and checking against the worked examples
- level-grouped Learners ready to extend find a missing scale factor given a drawing and an actual length
- outdoor-only Draw a real space on the ground at a stated scale and pace out the actual lengths to check
Lesson 11 — Scale Drawings
Summary
Learners read and make scale drawings, using a scale ratio to convert between drawing lengths and actual lengths. They find actual lengths from a map or plan, reproduce a drawing at a given scale factor, and explain what the scale means.
Objectives
- Solve a problem with a scale drawing, using the scale to find actual or reproduced lengths. (D05.S3.07.02)
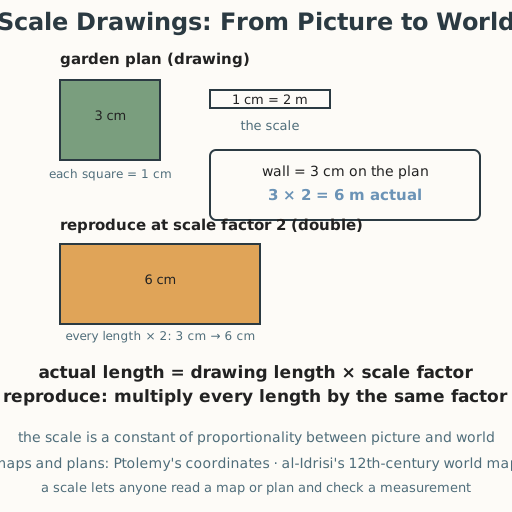
Connection
A map cannot be as big as the land, so it shrinks the land by a fixed amount: “1 cm = 2 m” means every centimetre on the page stands for 2 real metres. If a garden wall measures 3 cm on the plan, the real wall is 3 × 2 = 6 metres. A floor plan, a bus map, a ship’s chart, a model car — all are scale drawings, each with a scale that lets you travel from the small picture back to the big world. Mapmakers in many traditions drew the world to scale: the 12th-century geographer al-Idrisi made a celebrated world map for the court in Sicily, and Ptolemy’s earlier coordinates set places in proportion. A scale is the bridge between a picture and the real thing.
Materials
- Grid paper and rulers
- Scale problem cards
- A printed map or floor plan (where available)
Preparation
- Copy scale problem cards and grid paper.
- Have worked examples ready: a 3 cm wall at “1 cm = 2 m” → 6 m actual; reproduce at scale factor 2.
- Recall from Lesson 3: scale as a proportional relationship.
Facilitator note
This lesson is written to the learner (“you”). The ideas to land: (1) a scale drawing uses a
fixed scale (a ratio like 1 cm : 2 m) so every drawing length corresponds to a real length by
multiplying; (2) to find an actual length, multiply the drawing length by the scale factor; (3)
to reproduce at a given scale factor, multiply every length by that factor. Because scale
conversion is a foundational skill, use explicit instruction, worked examples, and guided practice
before independent work (Kirschner, Sweller & Clark, 2006). Watch for the slips of confusing
“1 cm = 2 m” with “2 cm = 1 m” and of scaling only some lengths when reproducing. Retrieval: ask
learners to recall the constant of proportionality (Lessons 3 and 8) — the scale is a constant of
proportionality between drawing and real lengths. The global lens: maps and plans to scale are a
shared human achievement — Ptolemy’s coordinates and al-Idrisi’s 12th-century world map are
documented examples. The egalitarian lens (docs/philosophy.md §4): a scale lets anyone read a
map or plan and check a measurement — navigation and building are open to all, not experts alone.
Procedure
- Gather (5 min). You have used scale as a proportion. Today you use it to move between a picture and the real world.
- Meet the scale (10 min). A scale drawing shrinks or enlarges an object by one fixed amount. “1 cm = 2 m” means 1 cm on the page is 2 m in real life. The scale factor is the multiplier from drawing to reality.
- Worked example — find actual length (10 min). A garden plan shows a wall 3 cm long at “1 cm = 2 m”. Multiply the drawing length by the scale factor: 3 × 2 = 6 m. The real wall is 6 metres.
- Worked example — reproduce (10 min). Reproduce the garden at scale factor 2 (twice as big). Multiply every length by 2: a 3 cm wall becomes 6 cm, a 4 cm wall becomes 8 cm. The shape keeps its proportions — that is what “to scale” means.
- Practice with a partner (10 min). Take your scale problem cards. For each, read the scale, convert the length (multiply by the scale factor), and, where asked, reproduce at a new factor. Trade and check each other’s multiplications and labels.
- Close (5 min). A scale drawing uses one fixed multiplier. Multiply to find actual lengths, and multiply every length by the same factor to reproduce. The scale is the bridge between picture and world.
Differentiation
- Support: Use only whole-number scales (1 cm = 2 m) on grid paper where counting squares helps; describe each step aloud so learners with low vision can follow by listening.
- Extension: Find a missing scale factor given a drawing and an actual length, and compare two drawings at different scales to say which is larger.
Assessment
- Formative (observation/self): Can the learner read a scale, convert between drawing and actual lengths by multiplying, and reproduce a drawing at a given scale factor with correct labels?
- Self-check: The learner asks, “Did I multiply by the right scale factor (drawing × factor = actual)? When reproducing, did I multiply every length by the same factor, and are my units correct?”
Home connection
At home, find a map or plan (or draw a simple room to scale), read its scale, and convert one drawn length to a real length — then pace it out to check.
Resources
- Scale drawings and scale factors are standard in middle-grades geometry; see John A. Van de
Walle, Elementary and Middle School Mathematics (10th ed., 2019). The notes that Ptolemy used
coordinates (Encyclopaedia Britannica, “Ptolemy,” S-299) and al-Idrisi made a celebrated
12th-century world map (Encyclopaedia Britannica, “Muhammad al-Idrisi,” S-298) are documented
history; treating all traditions as worthy is a value (
docs/philosophy.md§4). The claim that maps should be readable by everyone is a value commitment.