Lesson 16 — Our Data Fair
The unit's capstone: learners ask a real question, collect data from the group, draw a picture graph and a bar graph, and use adding and subtracting within 100 to answer "how many more or less." They present their finding to the class in a data fair.
Objectives
Objectives
- D05.S4.02.02 Draw and interpret picture graphs and bar graphs and answer questions about how many more or less.
- D05.S1.02.02 Add and subtract within 100 using models, drawings, or written methods, and explain the strategy used.
Essential question
How do I ask a real question, collect data, graph it, and use adding and subtracting to answer "how many more or less"?
Key vocabulary
Materials
Standard materials
- A survey question and recording sheet · 1 per pair or group A question to ask the class and a way to tally answers
- Paper or slate and a drawing tool · per learner To draw a picture graph and a bar graph
- Small objects or marks · per learner To build a picture graph
Low-tech / no-cost
- Found objects and the ground Build graphs on the ground with stones and sticks, and count the bars
- Voice and body Make a living bar graph with learners standing in rows, then count and compare
Enriched / lab & device
- Grid paper and a poster sheet · 1 per pair To draw neat, display-ready bar graphs
- A class "data wall" · 1 A shared space to hang every group's graph for the fair
Works in different contexts
- large-group Each group surveys a different question, graphs it, and presents one finding to the whole class
- self-directed A learner surveys their family or a small group, graphs the answers, and writes two findings
- outdoor-only Build and present graphs outdoors with stones and living bars, sharing findings in a circle
- multi-age Older learners help write questions and count bars while younger learners collect answers and present
- level-grouped Groups form by interest in a question, not by skill; within each group, learners take the role that fits them best
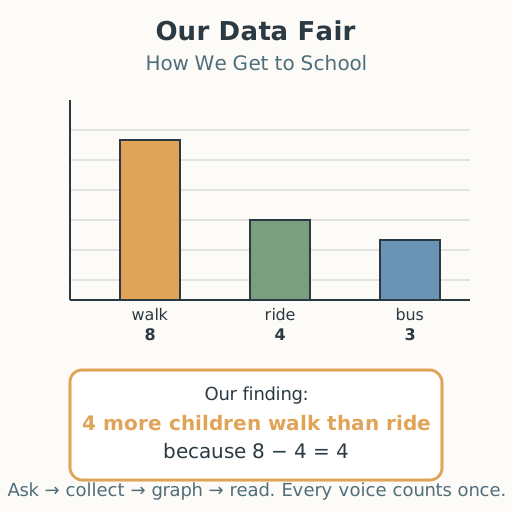
Lesson 16 — Our Data Fair
Summary
The unit’s capstone: learners ask a real question, collect data from the group, draw a picture graph and a bar graph, and use adding and subtracting within 100 to answer “how many more or less.” They present one finding to the class in a data fair, celebrating what the whole unit made possible.
Objectives
- Draw and interpret picture graphs and bar graphs and answer questions about how many more or less. (D05.S4.02.02)
- Add and subtract within 100 using models, drawings, or written methods, and explain the strategy used. (D05.S1.02.02)
Connection
This whole unit you have learned to count, group, add, subtract, see patterns, and measure — and now it all comes together. A class that wants to plan a celebration asks “how will we get there?” and graphs the answers; a village that wants to plant trees counts who will help; a family plans a trip and counts the days. Data is people’s answers, and the math you know — adding and subtracting — is how you read what the data says. Today you do what data-keepers do everywhere: ask, collect, graph, and share.
Materials
- A survey question and recording sheet (per pair or group)
- Paper or slate and a drawing tool
- Small objects or marks for a picture graph
Preparation
- Help each pair or group choose one respectful question with no “right” answer.
- Prepare recording sheets and graph paper.
- Set up a space to share findings (a “data fair” wall or circle).
Facilitator note
This lesson is written to the learner (“you”). It is the unit’s capstone, weaving together place value, adding and subtracting within 100, and graphs. Learners work in pairs or small groups and take the role that fits them — asking, tallying, drawing, counting, or presenting — so success is collective, not ranked (philosophy §8). The one new skill is integrating: reading a graph and answering “how many more or less” with subtraction. Teach it with a worked example (philosophy §13) if needed, but let the groups drive. The fair is a celebration of mastery, not a competition: every graph is honored, and every finding is real. No one’s graph is “better”; a clear, honest graph is the goal, and every learner’s contribution matters. For learners who are Deaf or hard of hearing, present findings in sign and point to the graph; for learners who are blind or low-vision, build a tactile graph and present by counting aloud. A learner who does not speak presents by pointing to bars and holding up the number. Celebrate every group.
Procedure
- Gather — the big question (5 min). Today is our data fair. With a partner or small group, choose a real question to ask everyone (favorite fruit, how we get to school, a game we like, a pet at home).
- Collect the data (12 min). Ask your question and tally the answers — one mark for each person, so everyone counts exactly once. Keep your tally neat, like a data-keeper.
- Graph it two ways (15 min). Draw your data as a picture graph and as a bar graph, with a title. Check that both show the same counts.
- Find your finding (12 min). Read your graphs. Which has the most? The fewest? Now answer “how many more or less” by subtracting: how many more chose the top answer than the bottom one? Write your finding as a sentence, using your adding and subtracting from this unit.
- Present at the fair (10 min). Each group shares one finding with the class, pointing to the bars. Listeners ask kind questions. Everyone’s graph is part of the fair.
- Close (6 min). Look at everything you made. You asked, collected, graphed, and read the answer — with the numbers, shapes, patterns, and data of this whole unit. That is mathematics: making sense of the world, together, for everyone.
Differentiation
- Support: Use a two- or three-answer question and count bars together; present one finding aloud with a partner.
- Support (motor): Have a partner draw while the learner tallies and counts.
- Extension: Write two findings, or combine two groups’ data and compare them, or predict what a bigger group would answer and say why.
Assessment
- Summative (portfolio): The learner’s picture graph and bar graph, kept as the unit’s data artifact.
- Observation: Can the learner collect data, graph it, and use adding/subtracting to answer “how many more or less”?
- Peer: Can the learner present a finding clearly and respond kindly to a classmate’s graph?
Home connection
At home, run a mini data fair: ask your family a question, graph the answers, and present one finding to them.
Resources
- National Research Council. (2009). Mathematics Learning in Early Childhood: Paths Toward Excellence and Equity. The National Academies Press. (Collecting, representing, and reasoning about data with graphs.)