Lesson 01 — Collect and Organize Data in Tables
Learners turn messy observations into data organized in a table with clear column headers. They run a quick absorbency investigation, record each result in a table, and notice that an organized table is what lets them see a pattern and support or revise a claim.
Objectives
Objectives
- D06.S1.06.01 Collect and organize data in tables and graphs, and use them to support or revise a claim.
Essential question
How do we turn messy observations into a table that can answer a question?
Key vocabulary
Materials
Standard materials
- Absorbency investigation page · 1 per learner A page with a blank table (cloth type | drops absorbed) and a space to write a claim
- A dropper or small spoon and a cup of water · 1 set per group To count drops (or spoonfuls) each cloth can soak up
- A few cloth or paper scraps of different kinds · 3–4 per group Different materials (cotton, wool, paper, plastic) to compare
Low-tech / no-cost
- Cloth scraps, a cup, and water Count spoonfuls of water instead of drops; no dropper needed
- Stones, sticks, and a patch of ground Sort and tally found objects (stones, seeds, leaves) into a table drawn in the dirt
Enriched / lab & device
- A simple balance or kitchen scale · 1 per group To measure absorbed water by mass (grams) for a more precise table
- A spreadsheet app or device · 1 per group To enter rows and columns and see a table (and, later, a graph) build itself
Works in different contexts
- large-group Collect one shared data set at the front; each learner fills the same table as you read the numbers aloud
- multi-age Younger learners make tally marks and count them; older learners design the column headers and explain why each column needs a label
- self-directed A learner runs the absorbency test alone, fills the table, and writes what the numbers seem to show
- level-grouped Learners ready to extend add a third column (mass in grams) or a second trial and note which variable stayed the same
- outdoor-only Sort and tally natural objects (leaves, seeds, stones) into a table drawn on the ground; name the variable each column holds
Lesson 1 — Collect and Organize Data in Tables
Summary
Learners begin the unit with the first step of any investigation: turning messy observations into data organized in a table. They run a quick absorbency test — which cloth soaks up the most water? — record each result under clear column headers, and see that a tidy table is what lets a pattern appear and a claim be supported or revised.
Objectives
- Collect data by observing, and organize it in a table with clear column headers. (D06.S1.06.01)
Connection
Every market stall, weather report, and farm record is built the same way: someone wrote down what they saw, one observation per line, under a clear heading. A fisher counting the day’s catch, a gardener noting how much each plant grew, a nurse recording each person’s temperature — all of them are making tables. A table is just a promise to write things down the same way every time, so that later the numbers can speak. Today you learn to keep that promise.
Materials
- Absorbency investigation page
- A dropper (or small spoon) and a cup of water
- A few cloth or paper scraps of different kinds
Preparation
- Print or draw the absorbency page with an empty three-column table.
- Gather cloth/paper scraps of clearly different kinds (one smooth and plastic-like, one thick, one thin) and a water cup per group.
- Recall Grade 3–4: recording observations and using tables to describe what data show.
Facilitator note
Written to the learner (“you”). The one skill to land is every column needs a clear
header, and every observation gets one row. Model the worked example first: you pour,
count drops aloud, and write the number under the right header, so novices see the
moves before doing them alone (Kirschner, Sweller & Clark, 2006). The key move is
consistency — same amount of water per test, same counting rule — because that is
what later lets learners use the data to support or revise a claim (Lessons 2). The
word “claim” here means a statement we can check against data; keep it in that
evidence-based sense. Note that this lesson practices the inquiry skills the unit
will return to with real science content in later lessons. See
docs/facilitation.md.
Procedure
- Gather (5 min). Think of a time someone wrote down numbers to answer a question — a score, a tally, a list. What made that list easy or hard to read?
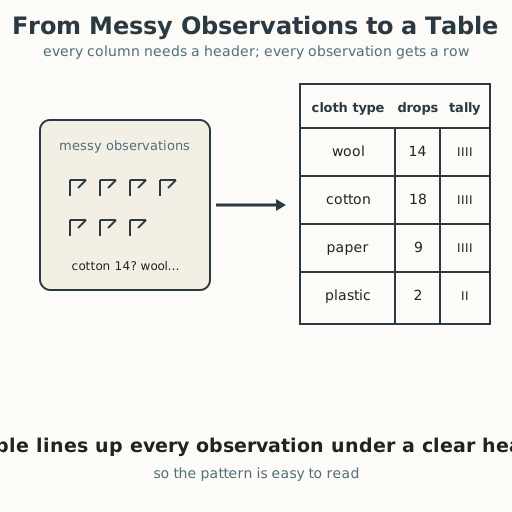
- Meet the table (10 min). Look at the diagram. A table is a grid of columns (up and down) and rows (across). The top row holds headers — the name of the thing you are recording. Look at the worked example: “cloth type” in the first column, “drops absorbed” in the second, “tally” in the third. Each test gets its own row. Why does every column need a header?
- Collect data (20 min). In your group, test each cloth: hold it over the cup, add water one drop (or spoonful) at a time, and count until it can hold no more. Write each result in its own row: the cloth’s name, the number of drops, and a small tally as you count. Keep the amount you add the same each time.
- Read the table (10 min). Look across your rows. Which cloth soaked up the most? The least? Write a first claim: a sentence the table seems to support — for example, “the thickest cloth soaked up the most water.” Would you bet on it, or do you want more data first?
- Close (5 min). A table is where messy observations become data — numbers lined up so a pattern can show. Tomorrow you will turn these same numbers into a graph and check whether they support or revise your claim.
Differentiation
- Support: Provide a pre-made table with headers and one filled example row; learners add only the remaining rows and count aloud.
- Extension: Add a second trial for each cloth and compare the two numbers — do they agree? What might that tell you?
Assessment
- Formative (observation): Does the learner place each observation in the correct row and column, and can they name what each column header means?
- Self-check: The learner asks, “Could someone else read my table and know exactly what I measured and how much?”
Home connection
Make a one-column table of one thing you can count at home for three days — cups of water you drink, birds you see, times you laugh. Write a header at the top. Bring the pattern you notice back to share.
Resources
- Khan Academy, “Reading tables” — what rows, columns, and headers do: https://www.khanacademy.org/math/cc-sixth-grade-math/cc-6th-data-statistics
- BBC Bitesize (KS3), “Different types of data” — turning observations into organised tables: https://www.bbc.co.uk/bitesize/topics/zsg6m39/articles/zxkh6g8