Lesson 11 — Capstone: Lines of Fit, and Why Association Is Not Causation
The unit capstone. Learners **fit a line informally to data** to model a relationship, **evaluate the fit**, use the line to predict, and — the year's honest lesson — explain that **association does not prove causation**. They then retrieve the whole unit's ideas and revisit the wonders they wrote in Lesson 1.
Objectives
Objectives
- D05.S1.08.01 Distinguish rational and irrational numbers and approximate square roots by locating them on the number line.
- D05.S1.08.02 Use integer exponents and scientific notation to represent and compare very large and very small quantities, such as distances in space or the size of cells.
- D05.S2.08.01 Define, evaluate, and compare functions and use function notation to describe how one quantity depends on another.
- D05.S2.08.02 Solve linear equations in one variable and analyze a pair of simultaneous linear equations by graphing.
- D05.S3.08.01 Describe translations, rotations, reflections, and dilations, and use them to show congruence and similarity.
- D05.S3.08.02 Use the Pythagorean theorem to solve problems about right triangles and distances.
- D05.S4.08.01 Construct and interpret scatter plots for two related variables and describe patterns of association.
- D05.S4.08.02 Fit a line informally to data to model a relationship, evaluate the fit, and explain that association does not prove causation.
Essential question
How do I fit a line to data, judge its fit, and explain — honestly — that association does not prove causation?
Key vocabulary
Materials
Standard materials
- Line-of-fit sheet · 1 per learner A scatter plot on which to draw an informal line of best fit and use it to predict, then judge the fit
- Unit map (from Lesson 1) · 1 per learner The learner's own Lesson 1 map and wonders, returned for the closing reflection
Low-tech / no-cost
- Voice and a shared board Draw the line of fit together with a ruler or string and judge it by eye; no cards needed
- A straight edge and a scatter of stones Lay a stick through a scatter of stones to fit a line and see how well it sits
Enriched / lab & device
- A spreadsheet or graphing tool · 1 per group To fit a line to data and compute how well it fits, where devices allow
- A gallery of real claims · 1 per group News headlines pairing two rising quantities, to test the question "does this prove cause?"
Works in different contexts
- large-group Fit one line together and judge it, then have pairs fit their own and explain why association is not causation
- multi-age Younger learners draw the line by eye; older learners judge the fit, predict, and argue the causation question
- self-directed A learner fits a line, predicts, judges the fit, and writes the causation argument, checking against the worked example
- level-grouped Learners ready to extend evaluate two different lines' fits (which points lie farthest) and critique a real headline's causal claim
- outdoor-only Lay a stick through a scatter of stones to fit a line, then debate a real "one thing rises with another" claim from the news
Lesson 11 — Capstone: Lines of Fit, and Why Association Is Not Causation
Summary
The unit capstone completes the data strand and closes the year. Learners fit a line informally to data, evaluate the fit, use the line to predict, and — the honest heart of the lesson — explain that association does not prove causation. They then retrieve the unit’s ideas and revisit the wonders from Lesson 1.
Objectives
- Fit a line informally to data to model a relationship, evaluate the fit, and explain that association does not prove causation. (D05.S4.08.02)
- Synthesize the unit’s eight objectives into one view of number, function, shape, and data, and return to the Lesson 1 wonders. (D05.S1.08.01, D05.S1.08.02, D05.S2.08.01, D05.S2.08.02, D05.S3.08.01, D05.S3.08.02, D05.S4.08.01, D05.S4.08.02 — synthesis)
Connection
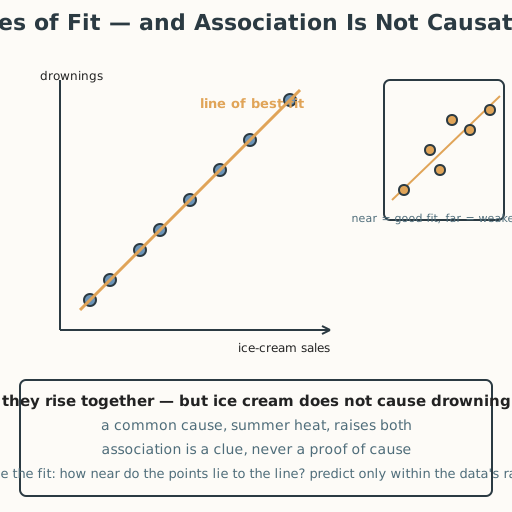
Ice-cream sales and drownings both rise in summer. Do ice creams cause drownings? No — a third thing, summer heat, raises both. This is the most important habit data can teach: two things moving together is a clue, not a proof. A line through the points lets you predict, but the line never proves why. Today you learn to fit that line honestly — and to say, with confidence, “they move together, but that does not mean one causes the other.”
Materials
- Line-of-fit sheet
- Unit map (from Lesson 1)
Preparation
- Copy the line-of-fit sheet; return each learner’s Lesson 1 unit map and wonders.
- Have worked examples ready: fit a line through study-hours vs. score points, predict a score at a new study time, and judge the fit by how near the points sit; then the ice-cream/drowning example.
- Retrieval: this capstone is itself a spaced, interleaved retrieval pass across the whole unit (Dunlosky et al. 2013, S-039) — it works because learners must recall, not re-read.
Facilitator note
This lesson is written to the learner (“you”). The ideas to land: (1) a line of best fit is drawn informally so about half the points sit on either side, and it models the relationship; (2) the fit is judged by how near the points lie to the line, and the line can then predict within the data’s range; (3) association does not prove causation — a common cause or coincidence may explain the pattern. Because fitting a line is a foundational skill, use explicit instruction and a worked example first (Kirschner, Sweller & Clark, 2006). This is a summative moment, but mastery is personal, not ranked — celebrate growth, never compare learners (philosophy §8). The critical- thinking lens is the lesson’s core: “correlation is not causation” protects people from false conclusions in medicine, policy, and daily life (S-355). The egalitarian lens: honest data reading lets anyone — not only an expert — question a claim that “this causes that” and ask who benefits from believing it. The environment lens: the same caution guards climate and health claims — a rising number does not by itself name the cause. Keep the four lenses explicit in the closing retrieval.
Procedure
- Fit the line (15 min). On your line-of-fit sheet, draw a straight line through the points so about half sit above and half below. This is your line of best fit — an informal model of the relationship. Judge the fit: are the points near the line or far? Use the line to predict one new value within the data’s range.
- Association is not causation (10 min). Ice-cream sales and drownings both rise in summer. Does ice cream cause drowning? No — summer heat raises both. Two things moving together is a clue, never a proof of cause.
- Retrieve the unit (15 min). With a partner, recall the eight ideas without looking: rational vs. irrational; square roots on the line; scientific notation; functions and f(x); solving linear equations; systems by graphing; transformations; the Pythagorean theorem; scatter plots and lines of fit.
- Revisit your wonders (7 min). Open your Lesson 1 map. Which wonders can you now answer? Which grew into new questions? Answer one you can, and keep one to wonder about.
- Close (3 min). Share one idea you can now explain. Remember: number, function, shape, and data are one sense-making habit — and honest data reading never mistakes a clue for a cause.
Differentiation
- Support: Provide a line pre-drawn and guide judging the fit by counting points on each side; describe each step aloud for learners with low vision.
- Accessibility: Fit the line tactilely with a string or stick through raised dots or stones and describe the fit aloud for learners who are blind or have low vision; for learners with dyscalculia, keep the task qualitative (near/far, above/below) and center the causation argument rather than computation.
- Extension: Compare two candidate lines and argue which fits better (which leaves points farthest), and critique a real headline’s causal claim by naming a possible common cause.
Assessment
- Summative (portfolio + self): The completed line-of-fit sheet is the unit’s capstone artifact, kept in the portfolio, alongside the Lesson 1 map with answered wonders.
- Self-assessment: Learners mark one idea they can explain confidently and one they will keep learning — “not yet” is information, never a verdict.
Home connection
Share with someone at home the rule “association is not causation,” and find one real claim (in the news, an ad, or a conversation) where two things rise together — then ask together what else might explain it.
Resources
- On “correlation does not imply causation”: Wikipedia, “Correlation does not imply causation” (S-355). On spaced, interleaved retrieval as a capstone: Dunlosky et al. (2013), https://doi.org/10.1177/1529100612453266 (S-039). On explicit instruction for novice skills: Kirschner, Sweller & Clark (2006), S-011.