Lesson 05 — Linear & Exponential Models
Learners **model real situations with linear and exponential functions**, telling them apart by their signature: a linear function adds a **constant difference** each step, while an exponential function multiplies by a **constant ratio** (growth factor). They build tables and formulas for both and meet the doubling story that shows why exponential growth surprises us.
Objectives
Objectives
- D05.S2.09.01 Model real situations with linear and exponential functions and interpret slope and intercept in context.
Essential question
How do linear and exponential functions model real change, and how do I tell them apart?
Key vocabulary
Materials
Standard materials
- Table-building sheet · 1 per learner A two-column template for building tables from situations and checking for constant difference vs. constant ratio
- Worked-example card · 1 per learner Two side-by-side situations — pay by the hour (linear) and money doubling (exponential) — with tables and formulas
Low-tech / no-cost
- A shared board or large paper Build both tables together; learners copy by hand
- Beans, seeds, or stones · a small pile per pair Physically add the same amount (linear) or double (exponential) to feel the difference
Enriched / lab & device
- A spreadsheet or graphing tool · 1 per learner Enter both formulas and watch the exponential curve overtake the line
- A short video or story of the rice-and-chessboard legend · 1 A telling of the Indian legend where doubling grains on a chessboard grows beyond all expectation
Works in different contexts
- large-group Build the two tables as a whole group, then pairs create one new linear and one new exponential situation
- multi-age Younger learners extend the linear table; older learners build the exponential table and write both formulas
- self-directed A learner fills both tables, writes each formula, and invents one new situation of each kind
- level-grouped Learners ready to extend compare linear and exponential growth over longer times and explain when exponential overtakes linear
- outdoor-only Count something that grows by doubling (a plant's leaves, a rumor passing through a group) and model it as exponential
Lesson 5 — Linear & Exponential Models
Summary
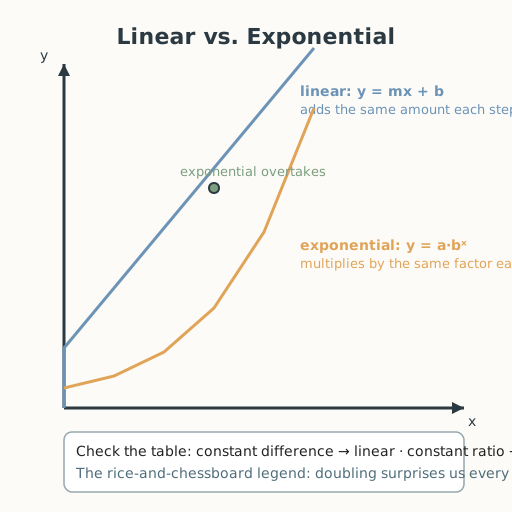
Learners model real situations with linear and exponential functions, telling them apart by their signature: a linear function adds a constant difference each step, while an exponential function multiplies by a constant ratio (the growth factor). They build tables and formulas for both and meet the doubling story that shows why exponential growth surprises us.
Objectives
- Model real situations with linear and exponential functions and interpret slope and intercept in context. (D05.S2.09.01)
Connection
Two ways something can grow: by adding the same amount each time, or by multiplying each time. Earn a fixed wage and your pay grows by the same amount every hour — that is linear. Put money in an account that earns interest, and each year it grows by a percentage of what is already there — that is exponential. The two look similar at first and then behave completely differently. Today you learn to tell them apart and to write the model that matches the situation.
Materials
- Table-building sheet
- Worked-example card
Preparation
- Copy the table-building sheet and worked-example card.
- Retrieval: from Grade 8, recall functions, function notation, and the form y = mx + b.
Facilitator note
This lesson is written to the learner (“you”). The skill to land: a linear function has a constant difference — the same amount added each step — and fits the form y = mx + b; an exponential function has a constant ratio — the same factor multiplied each step — and fits the form y = a·bˣ, where b is the growth factor. This is a skill, so use a worked example first, then guided practice (S-011). Model two situations side by side: pay of 12 currency units per hour (linear: 12, 24, 36, 48…; y = 12x) and a sum that doubles each day (exponential: 1, 2, 4, 8, 16…; y = 1·2ˣ). The critical-thinking lens: the rate of change tells you which family you are in — check for constant difference or constant ratio, don’t guess from two points alone. The global lens: the rice-and- chessboard legend — in which doubling a grain of rice on each square of a chessboard grows to more rice than the whole kingdom has — is a many-centuries-old story of exponential surprise (S-429). The egalitarian lens: exponential growth is why small differences in a growth rate (an interest rate, a disease’s spread) compound into big gaps — a fairness question when one person’s rate is slightly higher than another’s. The ethics lens: naming growth honestly matters for decisions that affect others — a loan that doubles, a rumor that spreads, an epidemic that compounds — so we must not understate or overstate what the model predicts (philosophy §5). The technology & environment lens: exponential growth is also the mathematics of population, resource use, and carbon, and a spreadsheet or graphing tool makes the curve visible — but the human must read what the curve means for real people and the Earth. Keep the models tied to real things; no bare symbol-pushing.
Procedure
- Recall (5 min). From Grade 8: what does y = mx + b mean? What is a function?
- Meet the two families (10 min). A linear function adds the same amount each step (a constant difference). An exponential function multiplies by the same factor each step (a constant ratio). Read the two worked examples.
- Study the worked examples (12 min). Linear: pay of 12 per hour — table 12, 24, 36, 48…, difference is always 12, formula y = 12x. Exponential: a sum doubling daily — table 1, 2, 4, 8, 16…, ratio is always 2, formula y = 1·2ˣ.
- Guided practice (15 min). With a partner, build tables and write formulas for: (a) a car traveling 80 km each hour (linear); (b) a population of bacteria tripling each hour, starting at 5 (exponential). Check each table for constant difference or constant ratio.
- Feel the difference (8 min). Using beans or stones, show 4 steps of “add 3” and 4 steps of “double.” Which pile grows frighteningly fast?
- Close (5 min). Linear adds; exponential multiplies. That one difference explains savings, epidemics, and the chessboard legend.
Differentiation
- Support: Provide the first three table rows filled and ask learners to extend and name the pattern (difference or ratio).
- Extension: Compare y = 2x and y = 2ˣ over x = 1…10 and write in words when the exponential overtakes the linear and why.
Assessment
- Formative (observation): Can the learner write the correct formula and state whether a table is linear (constant difference) or exponential (constant ratio)?
- Portfolio artifact: The completed table-building sheet with both formulas, kept in the portfolio.
Home connection
Find one thing at home that grows by adding (savings you add to each week) and one that grows by multiplying (interest, or a rumor spreading). Write each as a one-sentence model.
Resources
- On the history of growth and the doubling legend: Boyer & Merzbach, A History of Mathematics (S-429).
- On explicit instruction and worked examples: Kirschner, Sweller & Clark (2006), https://doi.org/10.1207/s15326985ep4102_1 (S-011).