Lesson 12 — Two-Way Tables & Fairness
Learners **use two-way tables and conditional relative frequencies** to explore relationships between categories. They compute joint, marginal, and conditional relative frequencies, learn that an overall rate can hide different rates inside subgroups, and use the table to ask questions of **fairness** — connecting to early data visualization for justice.
Objectives
Objectives
- D05.S4.09.02 Use two-way tables and conditional relative frequencies to explore relationships between categories, including questions of fairness.
Essential question
How do two-way tables and conditional relative frequencies reveal relationships between categories — including questions of fairness?
Key vocabulary
Materials
Standard materials
- Two-way-table sheet · 1 per learner A blank two-way table with rows and columns labeled, to fill with counts and then with conditional relative frequencies
- Worked-example card · 1 per learner A two-way table of an outcome by two categories, with joint, marginal, and conditional relative frequencies computed and read in a sentence
Low-tech / no-cost
- A shared board or large paper Build the table together; learners copy and compute by hand
- Countable objects (beans, stones, buttons) · a pile per pair Sort objects into the four cells to feel what a two-way table counts
Enriched / lab & device
- A spreadsheet or statistics tool · 1 per learner Enter counts and generate conditional relative frequencies to check by hand results
- A short image of a W. E. B. Du Bois data chart · 1 One of Du Bois's 1900 hand-drawn charts showing inequality between groups, as an early example of data used for fairness
Works in different contexts
- large-group Build one table together, then pairs compute the conditional frequencies and read them aloud
- multi-age Younger learners count the four cells; older learners compute and interpret conditional relative frequencies
- self-directed A learner fills the table, computes joint, marginal, and conditional relative frequencies, and writes what each reveals
- level-grouped Learners ready to extend construct a Simpson's-paradox example and explain how an overall rate can reverse within subgroups
- outdoor-only Survey two categories of a real group (e.g., two tree types, two areas) and build a two-way table of what you count
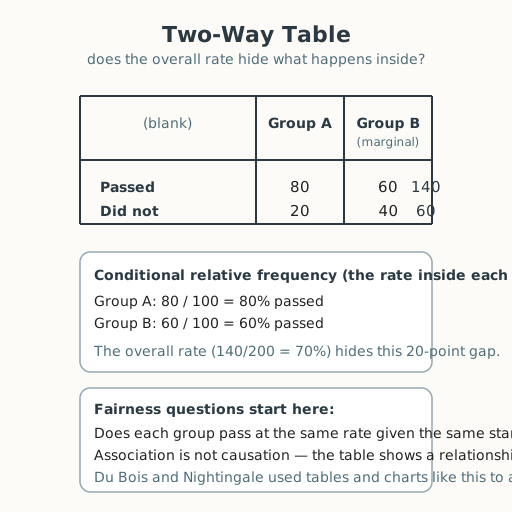
Lesson 12 — Two-Way Tables & Fairness
Summary
Learners use two-way tables and conditional relative frequencies to explore relationships between categories. They compute joint, marginal, and conditional relative frequencies, learn that an overall rate can hide different rates inside subgroups, and use the table to ask questions of fairness — connecting to early data visualization for justice.
Objectives
- Use two-way tables and conditional relative frequencies to explore relationships between categories, including questions of fairness. (D05.S4.09.02)
Connection
Suppose two schools report very different overall pass rates. You might assume one school is “better.” But a two-way table — arranging the data by two categories at once, like school and prior preparation — can show that the difference comes not from the schools but from who enrolls. The overall number hid a fairer picture. Two-way tables are how we check whether a difference is real or an illusion — and how we ask, honestly, who gets what outcome.
Materials
- Two-way-table sheet
- Worked-example card
Preparation
- Copy the two-way-table sheet and worked-example card.
- Retrieval: from Grades 6–8, recall relative frequency (a count divided by a total) and the idea that association is not causation.
Facilitator note
This lesson is written to the learner (“you”). The skill to land: a two-way table organizes counts by two categories; joint frequencies are the cell counts, marginal frequencies are the row and column totals, and a conditional relative frequency divides a cell by its row (or column) total to reveal the rate within a subgroup. Use a worked example first (S-011): a table of an outcome by two groups, computing joint, marginal, and conditional relative frequencies and reading each in a sentence. The critical-thinking lens: an overall rate can hide different rates inside subgroups — the core of Simpson’s paradox — so compute conditional frequencies before concluding. The ethics and egalitarian lenses: fairness questions live in conditional rates (does group A succeed at the same rate as group B given the same starting point?), and data has been used for justice — W. E. B. Du Bois hand-drew charts for the 1900 Paris Exposition showing the real condition of Black Americans against claims of inferiority, and Florence Nightingale used her statistical charts to argue for hospital reform (S-432, S-433). The global lens: cross-tabulating categories is the same honest act in every census and every study worldwide. The technology & environment lens: a spreadsheet computes conditional frequencies instantly, but the human must decide what the table reveals and what further evidence is still needed; and two-way tables are exactly how people track who has safe drinking water, care, or access — the same honest cross-tabulation maps both fairness and the environment. Emphasize: association is not causation — a table shows a relationship, not a cause; saying which requires more evidence.
Procedure
- Recall (5 min). From Grades 6–8: what is a relative frequency? What does “association is not causation” mean?
- Meet the table (8 min). A two-way table sorts counts by two categories. The inside numbers are joint frequencies; the row and column totals are marginal frequencies; a cell divided by its row or column total is a conditional relative frequency.
- Study the worked example (12 min). A table of “passed or not” by “studied in a group or alone.” Fill the joint and marginal frequencies. Then compute the conditional relative frequency of passing given group study, and given solo study. Read each in a sentence: “Among those who studied in a group, ___% passed.”
- Compute and interpret (15 min). On the two-way-table sheet, work a new table (two neighborhoods by “has safe drinking water or not,” or two groups by an outcome you choose). Compute joint, marginal, and conditional relative frequencies, and write what each reveals.
- Ask the fairness question (10 min). Does the overall rate match the rates inside the subgroups? If not, what might the overall number be hiding? What further evidence would you need before saying one group is treated unfairly? (Remember: association is not causation.)
- Close (5 min). A two-way table turns “one number” into “let me look inside.” That is where fairness questions begin.
Differentiation
- Support: Provide the table pre-filled with counts and ask learners to compute only the conditional relative frequencies and read them aloud.
- Extension: Construct a Simpson’s-paradox example — an overall rate that reverses within each subgroup — and explain, in words, how it happens.
Assessment
- Formative (observation): Can the learner compute a conditional relative frequency and read it in a sentence, and state one fairness question the table raises?
- Portfolio artifact: The completed two-way table with conditional relative frequencies and a written fairness question, kept in the portfolio.
Home connection
Think of a real “two categories” question in your life (two stores by “was the price fair?”; two teams by “did everyone get to play?”). Sketch a two-way table of what you would count and one conditional rate you would want to know.
Resources
- On W. E. B. Du Bois’s data visualization for justice: Battle-Baptiste & Rusert, W. E. B. Du Bois’s Data Portraits (S-432).
- On Florence Nightingale’s statistical charts: Wikipedia, “Florence Nightingale,” https://en.wikipedia.org/wiki/Florence_Nightingale (S-433).
- On real two-category data and fairness: Our World in Data, https://ourworldindata.org/ (S-006).
- On explicit instruction and worked examples: Kirschner, Sweller & Clark (2006), https://doi.org/10.1207/s15326985ep4102_1 (S-011).