Lesson 03 — Disruptions and Carrying Capacity
Learners explain **carrying capacity** — the largest population an environment can sustain — and how a **disruption** that removes food, water, or habitat lowers it. They read and draw an S-shaped growth curve and connect disruptions to the limiting factors they change.
Objectives
Objectives
- D06.S2.09.01 Explain how matter cycles and energy flows through ecosystems, and how disruptions affect carrying capacity.
Essential question
How do disruptions to an ecosystem change its carrying capacity, and who feels the effects?
Key vocabulary
Materials
Standard materials
- Carrying-capacity sheet · 1 per learner A blank S-shaped (logistic) growth graph with a carrying-capacity line to label, plus a second scenario to draw a lowered line
- Disruption cards · 1 set per group Cards describing disruptions (drought, overfishing, dam, fire, disease) to sort by which limiting factor each changes
Low-tech / no-cost
- A shared board or large paper Draw the S-curve and the carrying-capacity line together, then draw the effect of one disruption
- Voice and a partner Tell the story of one population — what limits it, what happens when a resource is removed
Enriched / lab & device
- A population-simulation tool or graphing app · 1 per group Change one resource and watch the S-curve and carrying capacity shift
- A short documentary clip of a real disruption (a fishery, a drought, an island) · 1 Analyze how the carrying capacity changed and who was affected
Works in different contexts
- large-group Model one S-curve to the whole group, then small groups analyze one disruption card and report the changed limit
- multi-age Younger learners match a disruption to the resource it removes; older learners redraw the S-curve at the new carrying capacity
- self-directed A learner labels the S-curve, then chooses one disruption and redraws the curve with a lower carrying capacity, writing a sentence to explain it
- level-grouped Learners ready to extend distinguish a short disturbance (population recovers) from a lasting change (carrying capacity itself is lowered)
- outdoor-only Observe a real patch of habitat and name its limiting factors — water, light, food, space — then discuss what a disruption would remove
Lesson 3 — Disruptions and Carrying Capacity
Summary
Learners explain carrying capacity — the largest population an environment can sustain — and how a disruption that removes food, water, or habitat lowers it. They read and draw an S-shaped growth curve and connect disruptions to the limiting factors they change.
Objectives
- Explain how matter cycles and energy flows through ecosystems, and how disruptions affect carrying capacity. (D06.S2.09.01)
Connection
Imagine a village well that holds enough water for a hundred people. When the village has twenty people, everyone drinks easily. As it grows, the well is stretched thinner; at a hundred, it is at its limit. If the well runs dry one season, that limit drops — not because the people changed, but because the water did. Every living thing lives inside such a limit. Ecologists call it carrying capacity, and a disruption is anything that moves that line.
Materials
- Carrying-capacity sheet
- Disruption cards
Preparation
- Copy the carrying-capacity sheet and disruption cards.
- Retrieval: from Lesson 2, recall that energy flows one way and matter cycles; from Grade 8, recall how a change in one population ripples through an ecosystem.
Facilitator note
This lesson is written to the learner (“you”). The idea to land: carrying capacity (K) is the largest population an environment can sustain given its limiting factors — food, water, space, shelter; a population that starts small grows, then slows and levels off near K (the S-shaped “logistic” curve); a disruption that removes a limiting resource lowers K. Use a worked example first (S-011): draw the S-curve and show that removing a resource shifts the dashed K line down. The critical-thinking lens: distinguish a disturbance (a shock the population can recover from) from a lasting change (K itself lowered — habitat permanently lost). The environment lens: humans change carrying capacity all the time — damming a river, overfishing, clearing forest, and (crucially) restoring habitat can raise it again. The egalitarian lens: when carrying capacity falls, the burden rarely falls evenly — those with the least fall first; a drought in one place and a flood in another land on different people, which is why caring for ecosystems is a question of justice, not just biology (see also D10, environmental justice, later this year). The ethics lens: knowing a population will overshoot and crash, a careful community can choose limits before the environment imposes them — a small act of foresight with real consequences. Cite the carrying-capacity source (S-436); the S-curve (exponential vs. logistic growth) is standard ecology (Britannica). Keep all numbers approximate and hedged.
Procedure
- Recall (5 min). From Lesson 2: what is a limiting factor? Name three things every population needs.
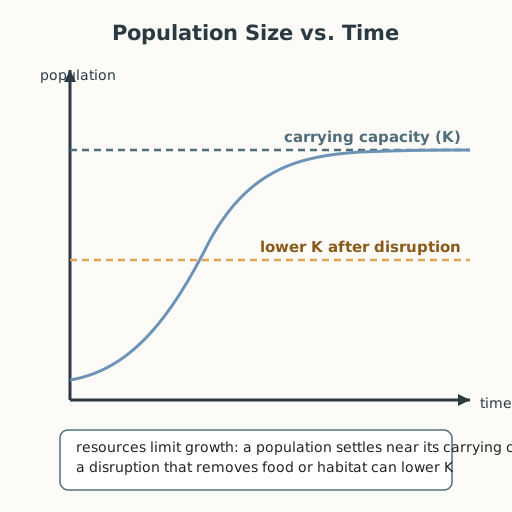
- Meet the S-curve (10 min). A population grows slowly at first, then quickly, then slows as it runs out of room and food, and levels off. The level it settles near is its carrying capacity (K). Label it on the sheet.
- Model a disruption (12 min). Worked example: a herd of deer lives in a valley with enough browse for 200. A fire removes half the browse. The carrying capacity drops toward 100. Draw the new, lower dashed line.
- Sort the disruptions (12 min). On the disruption cards, name which limiting factor each changes — food, water, space, or shelter — and whether it is a short disturbance or a lasting change of K.
- Redraw one curve (10 min). Choose one card. Draw the original S-curve and the new, lowered carrying capacity. Write one sentence: “This disruption lowered K because ___.”
- Close (6 min). Limits are real, but they are not fixed. Remove a resource and K falls; restore it and K can rise again.
Differentiation
- Support: Provide the S-curve pre-drawn; the learner only draws and labels the lowered carrying capacity line for one given disruption.
- Extension: Contrast exponential and logistic growth, and explain in one paragraph why no population grows without limit forever.
Assessment
- Formative (observation): Can the learner define carrying capacity and explain, with an example, how a disruption lowers it?
- Portfolio artifact: The labeled S-curve with one redrawn disruption scenario, kept in the portfolio.
Home connection
Find a local limit — a pond’s fish, a garden’s water, a bus’s seats — and ask: what is its carrying capacity, and what would happen if one resource were removed?
Resources
- On carrying capacity and logistic versus exponential growth: Encyclopaedia Britannica, “Carrying capacity,” https://www.britannica.com/science/carrying-capacity (S-436).
- On explicit instruction and worked examples: Kirschner, Sweller & Clark (2006), https://doi.org/10.1207/s15326985ep4102_1 (S-011).