Lesson 01 — Reading Data: Mean and Range
Learners compute the mean and the range as two summaries of a batch of data, see how an outlier pulls the mean, and begin to ask what any single summary hides. This opens the unit's statistical toolkit used across every later strand.
Objectives
Objectives
- D06.S1.10.01 Analyze data using basic statistics (mean, range, and trend) and assess how well the data support a conclusion.
Essential question
How do the mean and the range summarize a batch of numbers, and what do they leave out?
Key vocabulary
Materials
Standard materials
- Mean-and-range worksheet · 1 per learner A small dataset (a town's daily rainfall in mm over 7 days) with a worked mean-and-range example and practice sets
- Science journal · 1 per learner
Low-tech / no-cost
- A handful of found objects Pebbles, sticks, or seeds counted into piles to act out "mean" by sharing equally and "range" as shortest-to-longest
- Voice and fingers Say numbers aloud and count them on fingers; find the middle by sharing out loud
Enriched / lab & device
- Calculator or spreadsheet · 1 per learner or pair To compute mean and range for a larger dataset and see how one outlier shifts the mean
Works in different contexts
- large-group Compute the worked example whole-class on a shared board, then learners recompute in pairs with a different dataset and check each other
- multi-age Younger learners find the mean by physically sharing objects equally; older learners add the effect of an outlier and preview trend in Lesson 2
- self-directed A learner follows the worked example, then self-checks each practice set against the answer key before writing the "what the mean hides" reflection
- level-grouped Group by comfort with division, not age; a ready group moves to a 20-value dataset and the outlier question early
- outdoor-only Count real things outdoors — leaves per branch, steps between trees — and compute mean and range from what you gathered
Lesson 1 — Reading Data: Mean and Range
Summary
Learners compute the mean (a central value) and the range (a measure of spread) for small datasets, see how a single outlier pulls the mean, and ask what any one number leaves out. This is the unit’s opening statistical toolkit — the same mean and range they will use when they analyze data about inheritance, energy, climate, and the cosmos in later lessons.
Objectives
- Analyze data using basic statistics — mean, range, and trend — and assess how well the data support a conclusion. (D06.S1.10.01)
Connection
If someone asks, “how much rain does your town get?” you could list every day of the year — or you could give one number, the mean, that stands in for the whole batch. But one number always hides something: two towns can have the same mean rainfall while one is steady drizzle and the other swings between drought and flood. The range catches that swing — the gap between the smallest and largest values. Mean and range together are the first honest way to summarize numbers without pretending one number tells the whole story.
Materials
- Mean-and-range worksheet
- Science journal
Preparation
- Copy or draw the mean-and-range worksheet (the worked rainfall example below).
- Retrieval: from Grade 8 and 9, tables, bar graphs, and organizing data (D06.S1.06.01, D06.S1.09.01). Today we add two numeric summaries: mean and range.
- Prepare one worked example and three practice sets.
Facilitator note
This lesson is written to the learner (“you”). The idea to land: the mean is a central value (sum ÷ count); the range is a spread (largest − smallest); and a single outlier pulls the mean away from the typical value, while the range is exactly what catches that spread. Teach the computation with a worked example first — for a procedural skill like this, explicit instruction with guided practice beats discovery (S-011). Then let learners compute, self-check, and check each other.
The critical-thinking lens: every summary is a choice — what did the person choose to show, and what did they leave out? The ethics lens: numbers are used to make decisions about people; an average that hides the poorest or the most affected is a moral problem, not just a math one. The egalitarian lens: the mean and range are free, shared tools — any person, anywhere, can use them to read claims made about their own community, not be read by them. The global lens: the same two numbers work whether the data is rainfall in a monsoon region, a harvest in a dryland farm, or a fever chart in a clinic. Preview: Lesson 2 turns to trend — how well a whole dataset supports a conclusion.
Procedure
- Recall (5 min). From Grade 9: what are the parts of a data table, and how do you turn numbers into a bar graph? Name one time you saw a single number used to describe many numbers (a “average” in a news story, a score, a price).
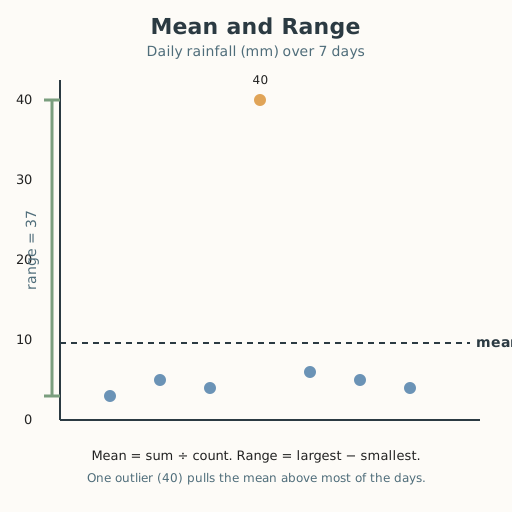
- Meet the mean and range (15 min). Here is a town’s daily rainfall in
millimetres over seven days: 3, 5, 4, 40, 6, 5, 4.
- Mean: add them (3+5+4+40+6+5+4 = 67), divide by 7 → 67 ÷ 7 ≈ 9.6 mm.
- Range: largest − smallest = 40 − 3 = 37 mm. Notice the outlier, 40, pulls the mean up to 9.6 — higher than six of the seven days. The range (37) is what exposes the one very wet day.
- Guided practice (15 min). With a partner, compute mean and range for three small sets (e.g., 4, 5, 6, 5, 4; then 2, 2, 2, 18, 2; then 10, 12, 11, 10). For each, write sum ÷ count and largest − smallest. Compare answers and agree before moving on.
- Independent practice (15 min). In your journal, compute mean and range for a set of eight numbers of your own (heights in your group, days of rain you remember, or any real numbers). Then remove the largest value and recompute the mean — how far did it move? Mark anything unsure with “not yet” and try again.
- Close (5 min). In one sentence: what does the mean capture, what does the range capture, and what does a single outlier do to the mean?
Differentiation
- Support: Use physical counters and share them equally to “see” the mean; give a pre-written sum to complete.
- Extension: Compare two towns with the same mean but very different ranges, and explain which is easier to plan a reservoir for, and why.
Assessment
- Formative (peer + self): Can the learner compute mean and range correctly, and explain how an outlier moves the mean?
- Portfolio artifact (unit): The completed worksheet with the “what the mean hides” reflection, as the first page of the unit’s data-and-evidence toolkit.
Home connection
Ask someone at home: what “average” numbers do you meet in a week — prices, scores, weather? Compute the mean and range of one small set together, and ask what that average might be hiding.
Resources
- On the use of worked examples and guided practice for novice skills: Kirschner, Sweller & Clark (2006), https://doi.org/10.1207/s15326985ep4102_1 (S-011).
- On descriptive statistics (mean, median, range) as background: Encyclopaedia Britannica, “Probability and statistics,” https://www.britannica.com/science/probability (S-301).