Lesson 13 — Inference from Samples: Margin of Error and Confidence
Learners evaluate claims made from samples: they distinguish population from sample, see why random sampling matters, and read a poll's margin of error and confidence interval as a range of honest uncertainty. They meet significance as "a result unlikely by chance alone" — not the same as importance — and connect inference to the sampling that underlies water quality, health, and public-opinion claims.
Objectives
Objectives
- D05.S4.12.01 Use inferential reasoning, including margin of error, confidence, and significance, to evaluate claims made from data.
Essential question
How do I use margin of error, confidence, and significance to evaluate a claim made from a sample?
Key vocabulary
Materials
Standard materials
- Inference sheet · 1 per learner A poll result to read with its margin of error, and a claim to evaluate for significance
- Math journal · 1 per learner
Low-tech / no-cost
- A jar of mixed beads or seeds and a scoop Draw samples by hand and see how the sample's share bounces around the true share
- Paper and pencil Compute a margin of error by hand from a sample size
Enriched / lab & device
- A spreadsheet or sampling simulation · 1 per pair Draw many random samples and watch the confidence interval cover the true value most of the time
Works in different contexts
- large-group Run a quick whole-class poll and compute its margin of error, then pairs evaluate a second claim
- multi-age Younger learners draw beads and see sampling bounce; older learners compute margins of error and significance
- self-directed A learner follows the worked example, computes a margin of error, and evaluates a claim
- level-grouped A ready group also explains why "significant" does not mean "important" and how sample size narrows the interval
- outdoor-only Sample a field or a tree's fruit by scooping at random spots, then estimate the whole from the samples
Lesson 13 — Inference from Samples: Margin of Error and Confidence
Summary
Learners evaluate claims made from samples: they distinguish population from sample, see why random sampling matters, and read a poll’s margin of error and confidence interval as a range of honest uncertainty. They meet significance as “a result unlikely by chance alone” — not the same as importance — and connect inference to the sampling that underlies water quality, health, and public-opinion claims.
Objectives
- Use inferential reasoning, including margin of error, confidence, and significance, to evaluate claims made from data. (D05.S4.12.01)
Connection
A poll says “54% support the plan, ±3%,” a water test says “12 parts per million,” a medicine is called “statistically significant.” Each is a claim about a whole built from a part — a sample standing in for a population — and each carries uncertainty. Reading the margin of error tells you how far the truth might be from the number; reading significance tells you whether a difference is real or just the luck of the draw. Both are how honest data speaks.
Materials
- Inference sheet
- Math journal
- Low-tech: jar of mixed beads, scoop, paper and pencil
Preparation
- Copy or draw the inference sheet with a poll result and a significance claim.
- Retrieval: from Grade 11 (D05.S4.11.02), sampling bias and drawing conclusions. Today we quantify the uncertainty.
- Prepare the margin-of-error worked example to model first (S-011).
Facilitator note
This lesson is written to the learner (“you”). The idea to land: a sample estimates a population with uncertainty; the margin of error (roughly 1/√n for a poll) widens or narrows with sample size; a confidence interval is the honest range; and “significant” means “unlikely by chance alone,” not “big” or “important.” Teach the margin-of-error computation explicitly (S-011), and keep the two words distinct — significance (a statistical claim about chance) vs importance (a value judgment) — because conflating them is a classic error.
The ethics lens: reporting the margin of error is honesty about uncertainty; hiding it is a way of overclaiming. The egalitarianism lens: a sample that leaves a group out is a biased estimate that misrepresents them — random, inclusive sampling is a fairness practice, not a technicality (S-242). The global lens: the mathematics of sampling is the same everywhere, but what gets sampled — and who is counted at all — differs by place and power; inference is global, but who is in the population is a local question (S-006). The technology lens: polls and A/B tests run inference at machine speed, which makes reading uncertainty more, not less, important. The environment lens: water and air quality, species counts, and climate trends are all claims from samples — a margin of error on a contaminant is a health decision (S-005). Preview: Lesson 14 turns to misleading statistics and defending with honest data.
Procedure
- Recall (5 min). From Grade 11, what made a sample biased? Today we put a number on uncertainty.
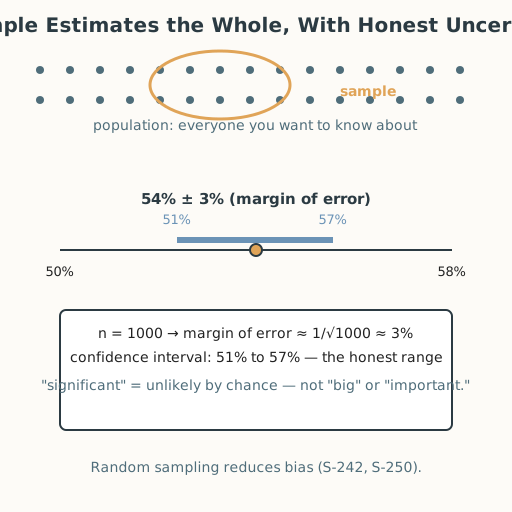
- Population and sample (8 min). The population is everyone or everything you want to know about; the sample is the part you measure. A fair sample is random — every member has a known chance of being drawn — because a skewed sample silently skews the answer (S-242).
- Worked example — margin of error (15 min). A poll of n = 1000 randomly chosen people finds 54% support. The margin of error is roughly 1/√1000 ≈ 3%. So the honest claim is “54% ± 3%” — the truth is plausibly anywhere in the confidence interval 51% to 57%. A bigger sample shrinks the interval; a smaller one widens it. Write the interval and say — aloud or in writing, sign, gesture, or AAC — what it means.
- Significance vs importance (8 min). “The new fertilizer raised yield by 2%, and the result was significant.” Significant means the 2% was unlikely by chance alone — it does not mean the 2% is large or worth it. Sort claims into “significant” and “important,” and find one that is significant but unimportant.
- Guided practice (12 min). With a partner, take a second poll (say n = 400, 60% agree): compute the margin of error (≈ 1/√400 = 5%), write the confidence interval, and evaluate whether “a clear majority agrees” is an honest reading. Swap and check.
- Retrieve and connect (5 min). Write one sentence on why a sample of 100 gives a wider honest range than a sample of 10,000, and one on a real thing you would want to sample fairly (water, soil, opinion).
- Close (2 min). Say — or write, sign, gesture, or use AAC to express — what a margin of error is, and what “significant” does not mean.
Differentiation
- Support: Draw beads from a jar, record the share of one color in several scoops, and see the shares bounce around the true share before computing anything.
- Extension: Explain how quadrupling the sample size halves the margin of error (1/√(4n) = ½·(1/√n)), and apply it to a stated sample size.
- Number access (dyscalculia): Provide a pre-computed margin-of-error table (n = 100 → ±10%, n = 400 → ±5%, n = 1000 → ±3%) so reading a poll’s uncertainty is a lookup, not a square-root calculation; offload any 1/√n arithmetic to a calculator or partner; and take the verbal route — draw beads from the jar, watch the share bounce, and say “the truth sits somewhere in the range around my estimate, and a bigger sample narrows that range” in words, without computing the interval.
- Communication access: Every spoken step — saying, naming, reading aloud, discussing, or closing — can be done in writing, sign, gesture, or AAC instead. Learners who are non-speaking, d/Deaf, hard-of-hearing, or who use AAC complete every task in their preferred mode; no step requires producing or hearing sound.
Assessment
- Formative (peer + self): Can the learner distinguish population from sample, compute a margin of error, read a confidence interval, and separate significance from importance?
- Portfolio artifact (unit): One poll read with its margin of error and confidence interval, plus a significance-vs-importance sentence, in the math journal.
Home connection
Find a percentage in the news at home (“60% say…”). Ask how many were sampled, estimate the margin of error, and write one sentence on the honest range the claim should state.
Resources
- On worked examples and guided practice: Kirschner, Sweller & Clark (2006) (S-011).
- On random sampling reducing bias: BBC Bitesize — Bias in science (S-242); Understanding Science (UC Berkeley) — bias (S-250). On the history of probability and statistics: Britannica — Probability and statistics (S-301). On environmental sampling (climate, water): IPCC (S-005).