Lesson 16 — Scaled Graphs & Our Data Celebration
The unit's capstone: learners ask a real question, collect data, and draw a scaled picture graph and a scaled bar graph — where one symbol or one square stands for two or more answers — then use multiplication, division, and comparison to read what the data say. They present one finding in a data celebration.
Objectives
Objectives
- D05.S4.03.02 Draw scaled picture and bar graphs and use them to solve problems and make comparisons.
- D05.S2.03.02 Solve two-step word problems using the four operations and explain the relationship between addition and subtraction or multiplication and division.
Essential question
How do I draw a scaled picture graph and a scaled bar graph, and use them to solve problems and make comparisons?
Key vocabulary
Materials
Standard materials
- A survey question and a way to record answers · 1 per group One question everyone can answer (favorite fruit, how we get to school, hours of sleep)
- Paper, grid paper, and a drawing tool · per learner To draw scaled picture and bar graphs
- Small objects or marks · per learner One mark per answer, then grouped into the scale
Low-tech / no-cost
- Found objects and the ground Build a scaled picture graph with stones (one stone = two people) and a bar graph with sticks on the ground
- Voice and body Make a living bar graph with learners standing in rows, using a scale of one person standing for two or five answers
Enriched / lab & device
- Grid paper and a poster sheet · 1 per group To draw neat, display-ready scaled bar graphs for a data wall
- A "data wall" or presentation space · 1 A shared space to hang every group's graph for the celebration
Works in different contexts
- large-group Each group surveys a different question, graphs it with a scale, and presents one finding to the whole class
- self-directed A learner surveys their family or a group, graphs the answers with a scale, and writes two comparison findings
- outdoor-only Build scaled graphs outdoors with stones and living bars, sharing findings in a circle
- multi-age Older learners help choose the scale and count bars while younger learners collect answers and present
- level-grouped Groups form by interest in a question, not by skill; within each group, learners take the role that fits them best
Lesson 16 — Scaled Graphs & Our Data Celebration
Summary
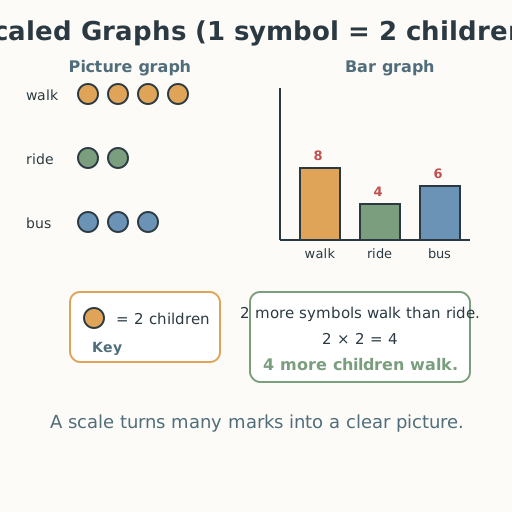
The unit’s capstone: learners ask a real question, collect data, and draw a scaled picture graph and a scaled bar graph — where one symbol or one square stands for two or more answers — then use multiplication, division, and comparison to read what the data say. They present one finding in a data celebration, gathering everything the unit made possible.
Objectives
- Draw scaled picture and bar graphs and use them to solve problems and make comparisons. (D05.S4.03.02)
- Solve two-step word problems using the four operations and explain the relationship between addition and subtraction or multiplication and division. (D05.S2.03.02)
Connection
This unit you have counted to a thousand, multiplied and divided, seen patterns, solved two-step stories, measured area and perimeter, and weighed and poured real things — and now it all comes together. A class that wants to plan a celebration asks “how will we get there?” and graphs the answers; a village counts its water jars; a family tallies its favorite meals. When there are many answers, one mark for each is too many marks — so people use a scale: one symbol stands for two, or five, or ten. The math you know — multiplying, dividing, comparing — is exactly how you read a scaled graph. Today you do what data-keepers do everywhere: ask, collect, scale, graph, and share.
Materials
- A survey question and a way to record answers (per group)
- Paper, grid paper, and a drawing tool
- Small objects or marks for a picture graph
Preparation
- Help each group choose one respectful question with no “right” answer.
- Prepare recording sheets, grid paper, and a data wall or sharing circle.
- Plan a worked example of a scale (one symbol = 2 people).
Facilitator note
This lesson is written to the learner (“you”). It is the unit’s capstone, weaving together the whole unit. The one new skill is the scale — drawing a graph where one symbol or square stands for two, five, or ten answers — and using multiplication and division to read it. Teach with a worked example (philosophy §13) if needed, but let the groups drive. The celebration is a festival of mastery, not a competition: every graph is honored, every finding is real, and every answer counts exactly once (egalitarianism). No one’s graph is “better”; a clear, honest graph is the goal, and every learner’s contribution matters. For learners who are Deaf or hard of hearing, present findings in sign and point to the bars; for learners who are blind or low-vision, build a tactile graph and present by counting aloud. A learner who does not speak presents by pointing to symbols and holding up the number. Celebrate every group.
Procedure
- Gather — the big question (5 min). Today is our data celebration. With a partner or small group, choose a real question to ask everyone (favorite fruit, how we get to school, a game we like, hours we sleep).
- Collect the data (12 min). Ask your question and tally the answers — one mark for each person, so everyone counts exactly once. Keep your tally neat, like a data-keeper.
- Choose a scale (8 min). If your counts are big, choose a scale: one symbol or one square stands for 2 (or 5) people. Show your scale in a key so anyone can read your graph.
- Graph it two ways (15 min). Draw your data as a scaled picture graph and a scaled bar graph, each with a title and a key. Check that both show the same counts — multiply to check (3 symbols × 2 people each = 6 people).
- Read and compare (12 min). Read your graphs. Which has the most? The fewest? Now answer “how many more or less” — multiply by the scale, then subtract. Write one finding as a sentence, using the operations of this unit.
- Present at the celebration (8 min). Each group shares one finding, pointing to the symbols and bars. Listeners ask kind questions. Every graph is part of the celebration.
Differentiation
- Support: Use a two- or three-answer question and a scale of one symbol = 2; present one finding aloud with a partner.
- Support (motor): Have a partner draw while the learner tallies and counts.
- Extension: Write two findings, or combine two groups’ data and compare them, or predict what a bigger group would answer and say why.
Assessment
- Summative (portfolio): The learner’s scaled picture graph and scaled bar graph, kept as the unit’s data artifact.
- Observation: Can the learner collect data, draw it to a scale, and use multiplication, division, and comparison to answer “how many more or less”?
- Peer: Can the learner present a finding clearly and respond kindly to a classmate’s graph?
Home connection
At home, run a mini data celebration: ask your family a question, graph the answers with a scale (one symbol = 2 people), and present one finding to them.
Resources
- National Research Council. (2009). Mathematics Learning in Early Childhood: Paths Toward Excellence and Equity. The National Academies Press. (Collecting, representing, and reasoning about data with graphs, including scaling.)