Lesson 16 — Line Plots with Fractional Data
Learners measure objects to the nearest half or quarter unit and record the measurements on a line plot — a number line with one mark per object — then answer questions about the data: which length is most common, which is least, and how many in all. Data becomes a picture you can read.
Objectives
Objectives
- D05.S4.04.02 Make and interpret line plots with fractional measurements and answer questions about the data.
Essential question
How do I make and interpret a line plot with fractional measurements?
Key vocabulary
Materials
Standard materials
- A ruler marked in halves and quarters · 1 per pair To measure objects to the nearest half or quarter unit
- Small objects to measure (leaves, strips, sticks) · a handful per pair To gather fractional measurements
- Paper or slate and a drawing tool · per learner To draw a line plot and answer questions
Low-tech / no-cost
- A string marked in halves and quarters, and found objects Measure objects by folding a string into halves and quarters, then mark the plot on the ground
- Voice and body Say each measurement aloud and place a stone on the ground plot
Enriched / lab & device
- A marked ruler and a data app or spreadsheet · 1 per pair To measure precisely and build a line plot on a device
- A large class line plot · 1 To collect everyone's measurements in one place
Works in different contexts
- large-group Collect the whole group's measurements on one large line plot and answer questions together
- self-directed A learner measures a set of objects, plots each measurement, and answers questions about the data
- multi-age Older learners interpret the plot (most, least, total); younger learners place the marks and read values
- level-grouped Learners who interpret easily answer comparison questions; others read single values first
- outdoor-only Measure leaves, sticks, or stones outdoors to the nearest half unit and plot them on a ground line
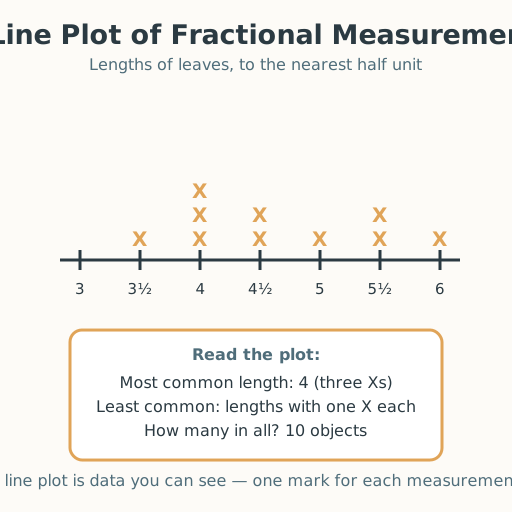
Lesson 16 — Line Plots with Fractional Data
Summary
Learners measure objects to the nearest half or quarter unit and record the measurements on a line plot — a number line with one mark per object — then answer questions about the data: which length is most common, which is least, and how many in all. This closes the unit: data becomes a picture you can read, and every skill from the unit — measuring, fractions, comparing — comes together in one honest chart.
Objectives
- Make and interpret line plots with fractional measurements and answer questions about the data. (D05.S4.04.02)
Connection
When many things are measured and the numbers are a little different each time, a list is hard to read. A line plot lines the measurements up in order and stacks a mark for each one, so the shape of the data appears: you can see at a glance which length is common and which is rare. Rain trackers, garden keepers, and scientists everywhere use plots like this to watch how things grow and change. Recording data honestly is a small act of truth-telling — you show what you measured, not what you wished it said.
Materials
- A ruler marked in halves and quarters (per pair)
- A handful of small objects to measure (leaves, strips, sticks) (per pair)
- Paper or slate and a drawing tool
Preparation
- Give each pair a marked ruler and objects to measure.
- Prepare (or plan to draw) a worked example line plot.
- Clear space to measure and mark.
Facilitator note
This lesson is written to the learner (“you”) and closes the unit. The new skill is building and reading a line plot with fractional measurements — a data representation that combines measuring, fractions, and comparing (Van de Walle, Karp & Bay-Williams, 2019; National Research Council, 2009). Model the plot once as a worked example (philosophy §13): measure several objects, mark each above its length on the number line, then read the plot together. This lesson is also the unit’s spaced retrieval payoff — ask learners to recall earlier skills (measuring from Lesson 14, fractions and comparing from Lessons 1–2 and 12–13) as they build the plot. A measurement that is a little off is not a failing; it is honest data, and every learner’s data has a place on the plot. A plot shows facts, never ranks people. Data-keeping is human and cross-cultural — people have recorded rainfall, harvests, and heights in many traditions, each an act of careful attention. Count in the home language. For learners who are Deaf or hard of hearing, sign each value; for learners who are blind or have low vision, use a tactile plot with raised marks. Learners with limited movement direct a partner to measure. Mastery arrives at its own pace.
Procedure
- Gather — many little differences (5 min). Measure several leaves or sticks. The numbers are close but not the same. How do you show them all at once? A line plot.
- Worked example — build a line plot (10 min). Draw a number line marked in halves. Measure each object to the nearest half unit, and for each object put one X above its length. If two objects are the same length, stack the X’s. Now read it: the tallest stack is the most common length; the lone marks are the rarest.
- Collect and plot your own (15 min). Measure your own set of objects to the nearest half or quarter unit. Draw your number line, mark each measurement, and stack the X’s.
- Answer questions (8 min). Read your plot: Which length is most common? Which is least? How many objects in all? What is the difference between the longest and shortest?
- Check with a partner (3 min). Trade plots. Can your partner answer the same questions about your data? Check together, kindly.
- Close — our data (4 min). Put your plot in your portfolio. Remember: a line plot is data you can see, and honest data is a small act of truth-telling — you show what you measured.
Differentiation
- Support: Measure to the nearest whole unit first; add halves and quarters another day.
- Support (blind/low-vision): Build a tactile plot with raised marks and read the stacks by touch.
- Extension: Measure to the nearest eighth of a unit and plot the finer data, explaining the new detail it shows.
Assessment
- Formative (observation): Can the learner measure to the nearest half or quarter unit, record each measurement as a mark on a line plot, and answer questions about the data?
- Artifact (portfolio): The completed line plot, kept as evidence of the unit’s data skill.
Home connection
At home, measure a set of small things (spoons, leaves, fingers) to the nearest half unit, draw a line plot, and tell a grown-up which size is most common and how you know.
Resources
- Van de Walle, J. A., Karp, K. S., & Bay-Williams, J. M. (2019). Elementary and Middle School Mathematics: Teaching Developmentally (10th ed.). Pearson. (Line plots and interpreting data with fractional measurements.)
- National Research Council (2009). Mathematics Learning in Early Childhood: Paths Toward Excellence and Equity. The National Academies Press. (The data representation trajectory: collecting, organizing, and reading data.)