Lesson 07 — Tables and Graphs of Two Quantities
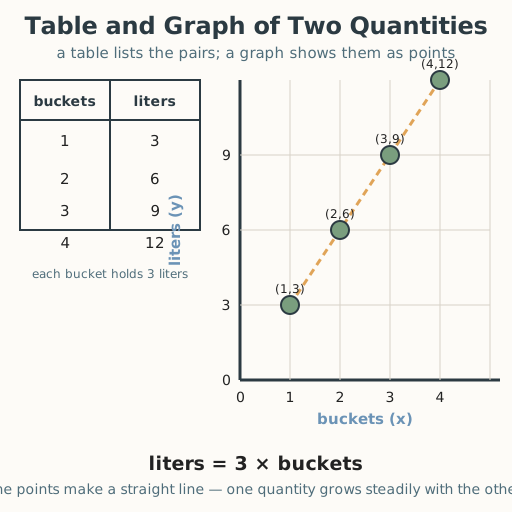
Learners represent the relationship between two quantities with a table and a graph. They build a table (buckets and liters: 1→3, 2→6, 3→9, 4→12), plot the ordered pairs on a first-quadrant grid, and notice the points make a straight line — one quantity grows steadily with the other.
Objectives
Objectives
- D05.S2.06.02 Represent the relationship between two quantities with a table and graph, and tell when one quantity depends on the other.
Essential question
How do I represent the relationship between two quantities with a table and a graph?
Key vocabulary
Materials
Standard materials
- First-quadrant grid · 1 per pair A grid numbered 0 to 8 on both axes with labeled axes and origin
- Two-quantity task cards · 1 set per group Situations with two related quantities (buckets and liters, hours and baskets) to table and graph
- Recording page · 1 per learner A page with blank tables and grids to record and graph each relationship
Low-tech / no-cost
- A chalk or dirt grid Draw a grid on the ground; place stones at points, counting across and up for each ordered pair
- Body coordinates Walk the relationship on a floor grid — steps across for the first quantity, steps up for the second
Enriched / lab & device
- A digital graphing tool · 1 per group A tool that plots points from a table and connects them, where devices allow
- A real measuring task · 1 per group Measure a real growing or filling situation (water into a bottle, plants over days) and table-and-graph it
Works in different contexts
- large-group Build one table and graph together at the front, then have pairs table-and-graph a card and share the relationship they see
- multi-age Younger learners fill the table by counting while older learners plot the points and describe the relationship
- self-directed A learner works the recording page alone, tabling and graphing each situation and checking against the worked example
- level-grouped Learners ready to extend predict the next ordered pair from the pattern and write the rule connecting the two quantities
- outdoor-only Measure a real relationship outdoors (buckets of water, steps and distance) and plot it on a chalk grid
Lesson 7 — Tables and Graphs of Two Quantities
Summary
Learners represent the relationship between two quantities with a table and a graph. They build a table (buckets and liters: 1 → 3, 2 → 6, 3 → 9, 4 → 12), plot the ordered pairs on a first-quadrant grid, and notice the points make a straight line — one quantity grows steadily with the other.
Objectives
- Represent the relationship between two quantities with a table and a graph. (D05.S2.06.02)
Connection
A family fetching water counts how much they carry: one bucket holds 3 liters, so two buckets hold 6, three hold 9, four hold 12. Write those pairs in a table, then plot them on a grid — the points climb in a straight line, and that line shows the whole story at a glance. Tables and graphs like this are how farmers track a crop’s growth, how bus drivers read distance against time, and how nurses read a fever chart — the same idea everywhere, from a clinic in Nairobi to a field in the Punjab.
Materials
- First-quadrant grid
- Two-quantity task cards
- Recording page
Preparation
- Copy grids for pairs, task cards for groups, and the recording page for each learner.
- Have a worked example ready: buckets (1, 2, 3, 4) → liters (3, 6, 9, 12); plot (1,3), (2,6), (3,9), (4,12).
Facilitator note
This lesson is written to the learner (“you”). The ideas to land: (1) a table lists pairs of related
quantities; (2) each pair becomes an ordered pair (x, y) on the coordinate plane — x across, y up;
and (3) plotted points can reveal the relationship (here, liters = 3 × buckets, a straight line). Model
a worked example first, then guide a second before independent work (Kirschner, Sweller & Clark, 2006).
Two common slips: reversing the ordered pair (going up first), and connecting points when the situation
does not allow in-between values. Retrieval: ask learners to recall first-quadrant plotting from Grade 5 —
this lesson extends it to a relationship between two quantities, with the table feeding the graph. The
critical-thinking lens: a graph is evidence — reading it carefully, not guessing a trend from one point, is
honest reasoning (docs/philosophy.md §7). Note the global point: coordinate grids trace to Descartes, but
locating a thing by two distances is older and appears in mapmaking traditions worldwide; data tables are
as old as bookkeeping and calendars.
Procedure
- Gather (5 min). Last time you solved for a mystery number. Today you watch two quantities grow together and turn them into a picture.
- Meet the table (10 min). A table lists pairs of related quantities. Buckets: 1, 2, 3, 4. Liters: 3, 6, 9, 12. Each bucket holds 3 liters, so liters = 3 × buckets.
- Worked example — make the table (10 min). Fill the table together: 1 bucket → 3 liters, 2 → 6, 3 → 9, 4 → 12. Read each row as an ordered pair: (1,3), (2,6), (3,9), (4,12).
- Worked example — graph (10 min). On the grid, put buckets along the x-axis (across) and liters up the y-axis. Plot each pair: (1,3), then (2,6), then (3,9), then (4,12). Connect them: a straight line. The line is the relationship.
- Practice with a partner (10 min). Take your task cards. For each situation, make a table, then plot the points. Check each other: across first, then up. Describe the relationship you see.
- Close (5 min). A table lists the pairs; a graph shows them. Together they turn a rule like “liters = 3 × buckets” into a picture anyone can read.
Differentiation
- Support: Use only whole-number pairs from 0 to 6 with a large labeled grid; describe each move aloud and use tactile grid lines so learners with low vision can follow by touch.
- Extension: Predict and plot the next pair (5, 15) and write the rule connecting the two quantities in words and symbols; make a table and graph for a situation of the learner’s own.
Assessment
- Formative (observation/self): Can the learner build a table of two related quantities and graph the ordered pairs correctly?
- Self-check: The learner asks, “Did I go across first and then up? Do my points make the shape I expected, and can I describe the relationship?”
Home connection
Track two related quantities at home over a few days (cups of water and plants’ growth, days and money saved) in a table, and plot the pairs on a grid.
Resources
- Representing two-variable relationships with tables and graphs is standard in middle-grades mathematics;
see John A. Van de Walle, Elementary and Middle School Mathematics (10th ed., 2019). The note that
locating by two distances predates Cartesian coordinates and appears in global mapmaking is a historical
observation; reading graphs as evidence rather than guessing trends is a critical-thinking value
(
docs/philosophy.md§7).