Lesson 03 — Sources of Error in an Investigation
Learners measure the same thing five times and discover that careful measurements still differ a little. They learn to name the sources of that difference — tool limits, human reading, and conditions — and suggest how to reduce each, by repeating trials, averaging, and using finer, steadier methods.
Objectives
Objectives
- D06.S1.06.02 Identify sources of error or bias in a simple investigation and suggest how to reduce them.
Essential question
Why do careful measurements still come out a little different — and how can we make them better?
Key vocabulary
Materials
Standard materials
- A ruler or marked stick · 1 per pair To measure the same length five times
- A small object to measure (a pencil, stick, or seed) · 1 per pair Something with a clear length
- Error-hunt page · 1 per learner Columns for five trials, the average, and "what could have gone wrong"
Low-tech / no-cost
- A marked stick and a found object Measure a twig's length five times with the same stick; note the small differences
- Voice and body Count aloud how long a friend holds a balance, several times, and discuss why the counts differ
Enriched / lab & device
- A stopwatch or timer app · 1 per group To time a repeated action and feel reaction-time error directly
- A ruler with finer marks (millimetres) · 1 per group To compare a rough measure against a finer, more precise one
Works in different contexts
- large-group Measure one object at the front five times and write the five numbers on the board; the group finds the spread and names the sources of error together
- multi-age Younger learners simply notice "the numbers are not all the same"; older learners name the source (tool, reading, conditions) and how to reduce each
- self-directed A learner measures one object five times, computes the average, and writes one source of error and one fix
- level-grouped Learners ready to extend compare a rough ruler against a fine one, and explain which gives less error and why
- outdoor-only Measure a leaf or shadow five times with a marked stick, and notice how wind or light changes the reading
Lesson 3 — Sources of Error in an Investigation
Summary
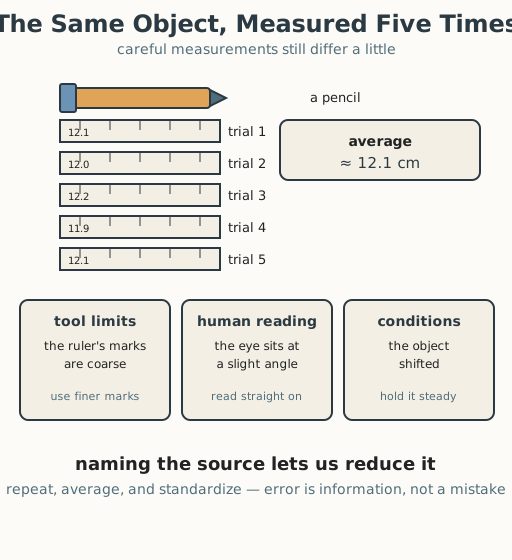
Learners measure the same object five times and find that their numbers are almost the same — but not exactly. They learn that error is not a mistake to hide but a feature of every real measurement, and they name its three usual sources — tool limits, human reading, and conditions — then suggest how to reduce each: repeat trials, average, and use finer, steadier methods.
Objectives
- Identify sources of error in a simple investigation and suggest how to reduce them. (D06.S1.06.02)
Connection
A tailor cutting cloth, a pharmacist weighing medicine, a builder setting a wall, a runner timing a lap — every one of them measures, and every one of them knows their measurement is never perfect. The mark on the ruler is a little coarse, the eye sits at a slight angle, the thing being measured shifts. Good measuring is not pretending there is no error; it is knowing where the error comes from and shrinking it. Today you learn to see the difference in your own measurements and to name it.
Materials
- A ruler or marked stick
- A small object to measure (pencil, stick, or seed)
- Error-hunt page
Preparation
- Print the error-hunt page with five trial rows and an average row.
- Prepare a ruler and a small object per pair.
- Recall Lesson 1–2: data goes in tables and graphs; now we ask how trustworthy it is.
Facilitator note
Written to the learner (“you”). The distinction to land is error is a spread, not a
mistake — careful measurements differ a little because of the tool, the reader, and
the conditions, and that is normal and reducible. Model the worked example: measure
one object at the front, read the value aloud, then point out why the next reading
might differ (the mark falls between two lines). Three named sources: tool limits
(coarse marks), human reading (angle of the eye, reaction time), and
conditions (the object moved, wind, light). Three named fixes: repeat (more
trials), average (the middle of the spread), and standardize (same tool, same
method, steadier setup). Keep the word “error” gentle — it is not a grade or a
judgment; it is information. This is a Grade 6 first pass; the statistical treatment
of uncertainty comes later. See
docs/facilitation.md.
Procedure
- Gather (5 min). How long is the object in front of you? Guess once. Now what do you think will happen if you measure it five times — all five numbers the same, or a little different?
- Measure five times (15 min). With a partner, measure the same object five times and write each number in its own row on your page. Use the same ruler and the same method each time. What do you notice about the five numbers?
- Find the spread and the average (10 min). Line the five numbers up from smallest to largest. How far apart are the biggest and smallest? Now find the average: add them and divide by five. The average is a steadier answer than any single measurement.
- Name the sources (10 min). Look at the diagram. Why were your numbers not all identical? Sort your reasons into the three sources: tool limits (the ruler’s marks are coarse), human reading (your eye sat at an angle; your hand was slow), and conditions (the object shifted). For each source, write one way to reduce it — repeat, average, use finer marks, hold things steady.
- Close (5 min). Error is not a secret to hide; it is a sign that you are measuring the real world. Naming where it comes from — and repeating, averaging, and standardizing — makes an investigation stronger.
Differentiation
- Support: Provide a two-source sort (tool | human) and a sentence starter: “the numbers differed because…”; do the averaging with a calculator or counters.
- Extension: Compare a rough ruler against a finer one, measure both ways, and explain which set has less spread and why precision matters for small objects.
Assessment
- Formative (observation): Can the learner name at least one source of error and one way to reduce it, and explain why the average is steadier than a single trial?
- Self-check: The learner asks, “If someone repeated my measurement, would they get about the same answer — and can I say what might change it?”
Home connection
Measure one thing at home five times (a door, a plant, a shelf). Show someone the five numbers and the average, and tell them which source of error you think made them differ.
Resources
- National Institute of Standards and Technology (NIST), “Uncertainty of Measurement Results” — why every measurement has some uncertainty: https://physics.nist.gov/cuu/Uncertainty/index.html
- BBC Bitesize (KS3), “Observation and measurement skills” — measuring, repeating, and error: https://www.bbc.co.uk/bitesize/topics/zsg6m39/articles/zm37jsg