Lesson 13 — Random Sampling and Bias
Learners draw random samples from a known population and estimate its make-up, discovering that a random sample is representative while a chosen (biased) sample misleads. They recognize bias in data-collection methods and state how to sample fairly.
Objectives
Objectives
- D05.S4.07.01 Use random sampling to draw conclusions about a population and recognize bias in how data is collected.
Essential question
How does a random sample let me draw a careful conclusion about a whole population, and how does bias mislead?
Key vocabulary
Materials
Standard materials
- Mixed beans or tokens · 1 container per group A container of two colours in a known proportion (the "population") to sample blind
- Sampling recording page · 1 per learner A page to record sample counts, estimate the proportion, and compare to the true value
- Sampling scenario cards · 1 set per pair Stories of biased vs. random sampling (a survey at one spot, a volunteer poll) to critique
Low-tech / no-cost
- A bag of two kinds of seeds Draw blind from a bag of two seed kinds, estimate the proportion, and check against the true mix
- Voice and body Learners stand in a line; a random handful is "sampled" while a chosen end is "biased"
Enriched / lab & device
- A random-sampling simulation · 1 per group A tool that draws random samples and shows estimates getting closer to the truth as samples grow, where devices allow
- A bias-detective game · 1 per group Cards pairing a survey method with a "biased / fair" verdict, for repeated play
Works in different contexts
- large-group Sample one class container together, then have pairs draw samples and compare estimates
- multi-age Younger learners draw and count the beans while older learners compute the proportion and judge bias
- self-directed A learner draws samples from the container, estimates the proportion, and checks against the true value
- level-grouped Learners ready to extend compare two estimates from different-sized samples and explain which is more reliable
- outdoor-only Sample a patch of ground by tossing a blind marker; a deliberate (non-random) choice shows the bias
Lesson 13 — Random Sampling and Bias
Summary
Learners draw random samples from a known population and estimate its make-up, discovering that a random sample is representative while a chosen (biased) sample misleads. They recognize bias in data-collection methods and state how to sample fairly.
Objectives
- Use a random sample to draw a conclusion about a population and recognize bias in data collection. (D05.S4.07.01)
Connection
Suppose you want to know what share of a village’s people like a new idea, but you can’t ask everyone. You ask a sample — a smaller group — and use it to guess about the whole population. If you pick the sample at random, it tends to look like the whole. But if you only ask the people standing near the market at noon, you have bias: your sample leaves out the farmers in the fields and the elders at home, and your conclusion is wrong. Sampling fairly is how medicines are tested, harvests are estimated, and public decisions are made — and noticing bias protects everyone from a wrong or unfair conclusion. Careful sampling is a matter of honesty, and therefore of ethics: a biased sample can harm the very people it leaves out.
Materials
- Mixed beans or tokens
- Sampling recording page
- Sampling scenario cards
Preparation
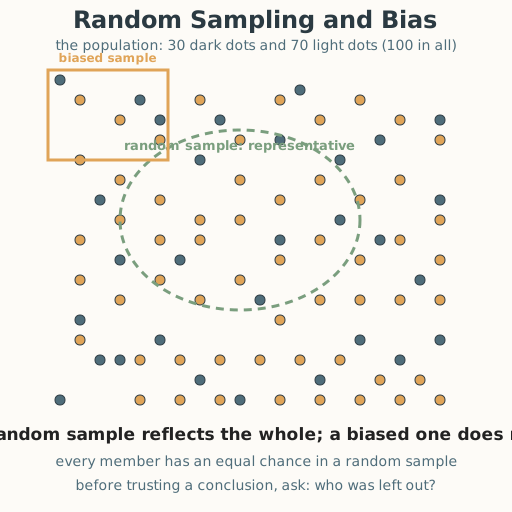
- Prepare containers with a known mix (e.g., 30 dark and 70 light beans) per group, hidden from view.
- Have worked examples ready: a blind draw of 20 beans with 6 dark → estimate 6/20 = 30% dark.
- Recall from Grade 6: summarizing data with mean, median, and range.
Facilitator note
This lesson is written to the learner (“you”). The ideas to land: (1) a population is the whole
group; a sample is a part used to estimate the whole; (2) a random sample (every member has
an equal chance) is representative, so its estimates are close to the truth; and (3) bias is
a non-random way of choosing that skews the sample and misleads the conclusion. Because sampling is
a foundational skill, use explicit instruction, worked examples, and guided practice before
independent work (Kirschner, Sweller & Clark, 2006). Watch for the slip of trusting a small or
hand-picked sample. Retrieval: ask learners to recall data summaries from Grade 6 — a sample
summarizes the population the way a mean summarizes a data set. The ethics and egalitarian lenses
(docs/philosophy.md §4): bias in sampling is not a neutral mistake — it can erase whole groups and
produce unfair decisions, so fair sampling is an ethical act. The critical-thinking lens
(docs/philosophy.md §7): always ask “who got left out of this sample?” before trusting a
conclusion.
Procedure
- Gather (5 min). You cannot always count everything. Today you learn to estimate a whole from a part — and to spot when that part misleads.
- Meet population and sample (10 min). The population is the whole group; a sample is a part of it. A random sample gives every member an equal chance to be picked, so it tends to represent the whole. A biased sample is chosen in a way that leaves some out.
- Worked example — draw blind (10 min). Your container holds a secret mix of dark and light beans. Draw 20 beans blind, mixing first. Count: 6 dark, 14 light. Estimate the population: 6/20 = 30% dark. Check against the true mix — is your estimate close?
- Meet bias (10 min). Now pick 20 beans on purpose, taking the ones you can see on top. If the top is mostly dark, your “sample” says the jar is mostly dark — bias has misled you. Compare the two estimates: random is close; chosen is not.
- Practice with a partner (10 min). Take your scenario cards. For each survey method, decide: is it a fair random sample, or is it biased? Name who is left out and how that skews the conclusion. Trade and check each other’s reasons.
- Close (5 min). A random sample represents the whole; a biased sample misleads. Before you trust a conclusion, ask: how was the sample chosen, and who was left out?
Differentiation
- Support: Use a small, clearly mixed container and draw blind several times; describe each step aloud so learners with low vision can follow by listening.
- Extension: Compare estimates from small and large samples and explain why larger random samples are usually more reliable; design a fair sampling plan for a real question.
Assessment
- Formative (observation/self): Can the learner draw a random sample, estimate a population proportion from it, and identify and explain bias in a given data-collection method?
- Self-check: The learner asks, “Did I mix and draw blind so every member had a fair chance? Is my estimate close to the truth, and can I name who a biased sample leaves out and how that misleads?”
Home connection
At home, think of a question about a whole group (family, street, class) and how you would sample it fairly — then name one biased way someone might sample it instead and who that bias would leave out.
Resources
- Random sampling and bias are standard in middle-grades statistics; see John A. Van de Walle,
Elementary and Middle School Mathematics (10th ed., 2019). The principle that random samples
are representative (and that larger random samples are more reliable) is a statistical result;
the claim that fair sampling is an ethical obligation is a value (
docs/philosophy.md§4), and the habit of asking “who was left out?” is critical thinking (docs/philosophy.md§7).