Lesson 06 — Rational Functions: Ratios That Model Rates
Learners meet the rational function as a ratio of two quantities and learn to read its vertical and horizontal asymptotes and domain from the algebra. They model a real rate — cost shared across a group, or concentration of a substance — and say what each asymptote means in context.
Objectives
Objectives
- D05.S2.10.01 Build and interpret polynomial and rational functions that model real relationships and describe their key features.
Essential question
How does a ratio of two quantities — one divided by another — become a function with its own shape, and what do its asymptotes mean in a real situation?
Key vocabulary
Materials
Standard materials
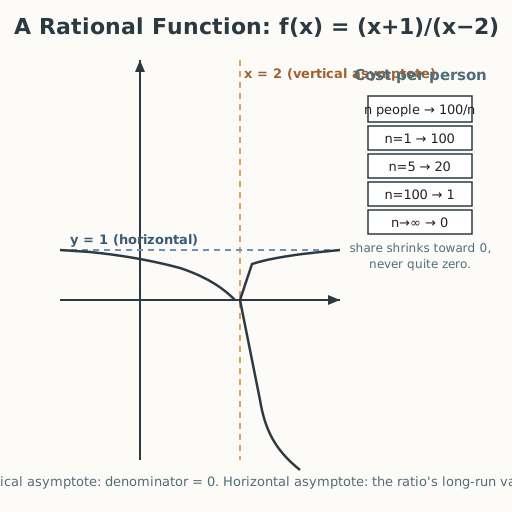
- Rational-function chart · 1 per learner A labeled graph of a rational function showing a vertical and a horizontal asymptote, with the average-cost model beside it
- Graph paper · 1 per learner
- Math journal · 1 per learner
Low-tech / no-cost
- Counters to share into piles Split a fixed number of counters among more and more people — the "cost per person" picture of a rational function
- String laid on the ground Bend it into the two branches of a hyperbola and mark a line it approaches but never crosses
Enriched / lab & device
- Graphing calculator or software · 1 per learner or pair To graph a rational function and see the asymptotes directly
Works in different contexts
- large-group Model the average-cost example whole-class, then learners find asymptotes of one new function each and compare
- multi-age Younger learners fill a table of "cost per person" values; older learners find asymptotes algebraically and distinguish holes from asymptotes
- self-directed A learner follows the worked examples, then finds asymptotes and domain of a new function and checks by graphing
- level-grouped Group by comfort with dividing polynomials; a ready group extends to a function with a hole (a common factor)
- outdoor-only Share a measured length or a pile of found objects among a growing number of people and record the shrinking share
Lesson 6 — Rational Functions: Ratios That Model Rates
Summary
Learners meet the rational function as a ratio of two quantities — one divided by another — and learn to read its vertical and horizontal asymptotes and domain from the algebra. They model a real rate (a shared cost, a concentration) and say what each asymptote means in context.
Objectives
- Build and interpret rational functions that model real relationships and describe their key features. (D05.S2.10.01)
Connection
Split the cost of a shared meal fairly among everyone at the table. With one person, they pay it all; with two, half each; with ten, a tenth each. As the group grows, each share shrinks toward zero but never quite vanishes — the cost per person is a ratio: total cost divided by number of people. That ratio is a function, and its graph has a shape worth reading: it plunges as the group grows, and it blows up if you ever try to divide by zero people. Many real quantities are ratios — speed is distance over time, density is mass over volume, concentration is solute over solution. Learning to read a rational function is learning to read “one thing divided by another” wherever it appears.
Materials
- Rational-function chart
- Graph paper
- Math journal
Preparation
- Copy or draw the rational-function chart.
- Retrieval: from Lesson 5, polynomial features; from Grade 9, functions and their domains. Today we look at what happens when we divide two quantities.
- Prepare the average-cost worked example.
Facilitator note
This lesson is written to the learner (“you”). The idea to land: a rational function is one quantity divided by another, and its asymptotes and domain are the algebra’s way of saying “here the denominator is zero” and “here the ratio levels off.” Teach the asymptote-finding routine explicitly (vertical: denominator = 0 and not canceled; horizontal: compare degrees of numerator and denominator), then practice (S-011).
The intellectual lens: the vertical asymptote is a division-by-zero the graph approaches but never reaches; the horizontal asymptote is the ratio’s long-run behavior. The critical-thinking lens: ask what each feature means in the real model — a vertical asymptote may mark a physically impossible point, and the domain must be read back into the real situation. The egalitarian lens: the shared-cost model is literally about fairness — dividing a burden among more people lowers each share; ask who can afford to be at the table at all. The technology lens: ratios are everywhere in tools and dashboards (rates, densities, per-capita figures); read them as rational functions, not magic numbers. Preview: Lesson 7 returns to exponential functions, the other great growth shape.
Procedure
- Recall (5 min). From Lesson 5, what is a function’s domain? What happens in arithmetic when you divide by zero? Keep that in mind.
- Meet the rational function (10 min). A rational function is a ratio of two polynomials, f(x) = P(x)/Q(x). Its domain excludes any x that makes Q(x) = 0 — division by zero is undefined.
- Read the asymptotes (15 min). Worked example: f(x) = (x + 1)/(x − 2).
- Vertical asymptote: set the denominator to zero → x = 2. The graph shoots up on one side and down on the other, approaching but never touching x = 2.
- Horizontal asymptote: the degrees of numerator and denominator are equal (both 1), so the ratio of leading coefficients is 1/1 = 1 → y = 1 as x grows large. The graph levels off toward y = 1.
- Hole: if a factor cancels (e.g. (x − a) in both), that x is a hole, not an asymptote.
- Model a real rate (15 min). A fixed cost of 100 is shared among n people: C(n) = 100/n. (a) Fill a table for n = 1, 2, 5, 10, 20, 100. (b) What is the horizontal asymptote, and what does it mean? (The share approaches 0 — never exactly zero, because someone always pays something.) (c) What happens at n = 0? (Undefined — “zero people” cannot share.) Sketch the curve.
- Guided practice (5 min). With a partner, find the vertical and horizontal asymptotes of g(x) = 2x/(x − 1) and state its domain.
- Close (5 min). Say in one sentence what a vertical asymptote and a horizontal asymptote each tell you about a real ratio.
Differentiation
- Support: Fill the cost table first and describe the trend in words before naming asymptotes.
- Extension: Identify a hole in h(x) = (x² − 1)/(x − 1) and explain why it is a hole, not an asymptote.
Assessment
- Formative (peer + self): Can the learner find the vertical and horizontal asymptotes and domain of a rational function, and interpret them in the shared-cost model?
- Portfolio artifact (unit): The rational-function chart with the cost model, added to the functions toolkit.
Home connection
Ask: what in our home is a ratio that changes? (Cost per person, distance per unit of fuel, water used per day.) Write it as a fraction, and say what happens as the bottom number grows toward zero or toward very large.
Resources
- On worked examples and guided practice: Kirschner, Sweller & Clark (2006), https://doi.org/10.1207/s15326985ep4102_1 (S-011).