Lesson 08 — Modeling Growth and Decay: Population, Finance, Environment
Learners apply the exponential model to compound interest, population growth, and environmental decay, using the rate to predict outcomes and the rule of 70 to estimate doubling time. They contrast unbounded exponential growth with logistic growth that levels off at a carrying capacity, and reflect on what the rate means for people and the planet.
Objectives
Objectives
- D05.S2.10.02 Model exponential growth and decay in population, finance, or environmental systems and explain the effect of the rate.
Essential question
How do I use an exponential model to read compound interest, population growth, and decay in the environment — and what does the rate actually do to the outcome?
Key vocabulary
Materials
Standard materials
- Modeling worksheet · 1 per learner Worked and practice problems for compound interest, population growth, decay, and the carrying-capacity contrast
- Math journal · 1 per learner
Low-tech / no-cost
- A pile of counters or grains Grow a pile by a fixed percentage each round and count — the concrete picture of compound growth
- A shared space to draw the S-curve in the ground Sketch exponential growth rising, then flattening at a ceiling — the carrying capacity
Enriched / lab & device
- Spreadsheet or calculator · 1 per learner or pair To compute compound interest over many periods and compare rates side by side
Works in different contexts
- large-group Solve one compound-interest example whole-class, then learners compare two rates in pairs and report the gap
- multi-age Younger learners compute a few compounding periods by hand; older learners use the full formula and contrast exponential with logistic growth
- self-directed A learner follows the worked examples, then models one population and one finance scenario and checks with a calculator
- level-grouped Group by comfort with the formula; a ready group extends to monthly compounding and to the carrying-capacity story
- outdoor-only Model a real population that levels off (a pond, a garden plot) and sketch its S-curve from observation
Lesson 8 — Modeling Growth and Decay: Population, Finance, Environment
Summary
Learners apply the exponential model to compound interest, population growth, and environmental decay, using the rate to predict outcomes and the rule of 70 to estimate doubling time. They contrast unbounded exponential growth with logistic growth that levels off at a carrying capacity, and reflect on what the rate means for people and the planet.
Objectives
- Model exponential growth and decay in population, finance, or environmental systems and explain the effect of the rate. (D05.S2.10.02)
Connection
A loan with 2% interest and a loan with 20% interest are not just “a little different.” Because interest compounds — each period’s interest earns interest too — the gap between the two rates widens into a chasm over time. The same arithmetic governs a population of people, a population of fish, a medicine leaving the body, and a pollutant breaking down in the ground. In every case the rate is the lever: a small change in the rate, repeated over many periods, changes everything. And real populations do not grow forever — they eventually press against the limits of the place that holds them, and the curve bends over into an S.
Materials
- Modeling worksheet
- Math journal
Preparation
- Copy or draw the modeling worksheet.
- Retrieval: from Lesson 7, y = a·bˣ and the growth factor; from Lesson 3, doubling and half-life. Today we put the model to work in three real domains.
- Prepare worked examples for compound interest, population, and the carrying-capacity contrast.
Facilitator note
This lesson is written to the learner (“you”). The idea to land: the exponential model A = P(1 + r)ᵗ (or with compounding periods, A = P(1 + r/n)ⁿᵗ) predicts growth and decay in finance, population, and the environment — and the rate is the lever, because it compounds. The rule of 70 (doubling time ≈ 70 ÷ rate in percent) is a quick, honest estimate. Real populations also reach a carrying capacity K, turning exponential growth into an S-shaped logistic curve (S-436). Teach the formula with worked examples (S-011), then let learners compare rates.
The environment lens is central: exponential growth against finite resources is the deepest environmental arithmetic there is — the S-curve’s ceiling is real (S-436). The ethics lens: lending rates can be fair or predatory; a small difference in interest decides whether a family sinks or swims. The egalitarian lens: the same rate hits people unequally — who borrows at 2% and who at 20% is often a matter of power and access, not merit. The global lens: fixed shares and rates have long histories across cultures — for example, zakat, a 2.5% (one-fortieth) share of wealth given yearly as an obligation of care in Islamic tradition (S-297) — a reminder that percentages have long been instruments of distribution, not only of profit. Hold facts and values apart: the math is descriptive; what counts as fair is a judgment we make together.
Procedure
- Recall (5 min). From Lesson 7, write the exponential function for a quantity growing 4% a year from 1,000. What is the growth factor? What does each part mean?
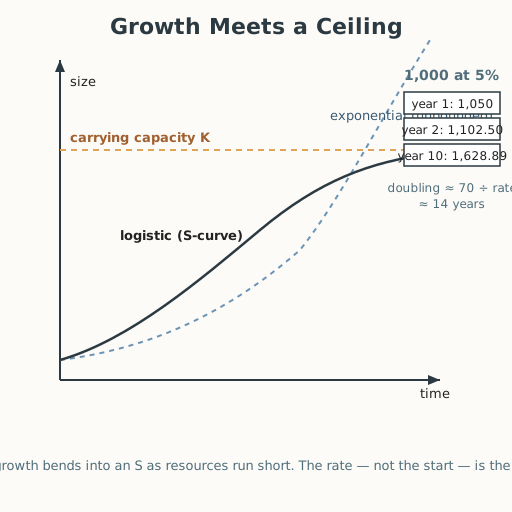
- Compound interest (15 min). Worked example: 1,000 saved at 5% a year, compounded yearly. After t years: A = 1000(1.05)ᵗ. Compute t = 1, 2, 5, 10. With monthly compounding the same 5% is split into twelve 5%/12 steps: A = 1000(1 + 0.05/12)¹²ᵗ. Notice the rate and the number of periods each move the answer.
- The rule of 70 (10 min). Doubling time ≈ 70 ÷ (rate in percent). At 5%, a population (or a sum) doubles in about 70 ÷ 5 = 14 years. Check against the table. Compare 2% (≈35 years) and 10% (≈7 years) — the rate is the lever.
- Growth meets a ceiling (15 min). Real populations cannot grow forever: as resources run short, growth slows and the population settles near its carrying capacity K, producing an S-shaped logistic curve instead of an unbounded exponential one (S-436). Sketch both: the exponential rising forever, and the logistic rising then flattening at K.
- Independent practice (5 min). In your journal, choose one: model a fish population growing 8% a year (state the doubling time), or model a pollutant whose amount halves every 10 years (state the half-life and the decay factor).
- Close (5 min). Say in one sentence why the rate — not just the starting value — is the lever in growth and decay, and why real growth eventually bends into an S.
Differentiation
- Support: Compute a few compounding periods by repeated multiplication before using the formula.
- Extension: Compare yearly and monthly compounding for the same rate and explain why more-frequent compounding grows faster; then describe what carrying capacity would mean for a human population.
Assessment
- Formative (peer + self): Can the learner apply the compound-growth model, use the rule of 70, and explain both the effect of the rate and the carrying-capacity limit?
- Portfolio artifact (unit): The modeling worksheet with the self-written population or decay model, as the unit’s “exponential model” artifact.
Home connection
Ask an adult about a loan or savings they know. Compute its doubling time with the rule of 70, and talk together about whether the rate feels fair and why.
Resources
- On carrying capacity and the logistic (S-shaped) growth curve: Encyclopaedia Britannica, “Carrying capacity,” https://www.britannica.com/science/carrying-capacity (S-436).
- On zakat as a fixed share of wealth: Encyclopaedia Britannica, “Zakat (Islamic tax),” https://www.britannica.com/topic/zakat-Islamic-tax (S-297).
- On worked examples and guided practice: Kirschner, Sweller & Clark (2006), https://doi.org/10.1207/s15326985ep4102_1 (S-011).