Lesson 08 — Modeling Periodic Phenomena
Learners fit sine and cosine functions to real repeating data — tides, daylight, and seasonal temperature — by reading amplitude from the high and low, the midline from their average, and the period from the time between repeats. They see the same four features become a model of the living world.
Objectives
Objectives
- D05.S2.11.01 Model periodic phenomena with trigonometric functions and interpret amplitude, frequency, and shift in context.
Essential question
How do I fit a sine or cosine function to real repeating data — tides, daylight, temperature — by finding its amplitude, frequency, and shift?
Key vocabulary
Materials
Standard materials
- Modeling problem sheet · 1 per learner Worked and practice problems fitting sine/cosine models to tide, daylight, and temperature data
- Math journal · 1 per learner
- Graph paper · 1 sheet per learner
Low-tech / no-cost
- Paper and ruler Sketch a wave through given high and low points to find amplitude and period by hand
- A stick and shadow Track a shadow's length over an hour to see a real repeating change
Enriched / lab & device
- Graphing calculator or plotting software · 1 per learner or pair To overlay a fitted sine curve on real data points and adjust A, B, C, D
Works in different contexts
- large-group Fit one tide model whole-class, then learners fit a daylight model in pairs
- multi-age Younger learners mark high and low points on a wave; older learners compute the full equation
- self-directed A learner follows the worked examples, then fits the practice set and checks the model at the given points
- level-grouped Group by comfort with Lesson 7's four features; a ready group fits a model with both vertical and horizontal shift
- outdoor-only Observe a real periodic signal (a shadow's length, water level, a pendulum) and estimate its amplitude and period
Lesson 8 — Modeling Periodic Phenomena
Summary
Learners turn Lesson 7’s four wave features into a working model: given real repeating data — tides, daylight, temperature — they read amplitude from the high and low, the midline from their average, and the period from the time between repeats, then write the sine or cosine function that fits. They connect the model to coastal and seasonal life everywhere.
Objectives
- Fit a sine or cosine function to real periodic data and interpret its amplitude, frequency, and shift in the context of tides, daylight, or temperature. (D05.S2.11.01)
Connection
Fishers, ferry pilots, and anyone who lives by the sea read the tide twice a day; farmers read the changing length of daylight across a year; everyone feels the seasonal swing of temperature. All of these are periodic — they repeat — and the four wave features let you write down the rhythm itself: how high it goes, how often it comes back, and where it sits on average.
Materials
- Modeling problem sheet
- Graph paper
- Math journal
Preparation
- Copy or draw the problem sheet.
- Retrieval: from Lesson 7, the roles of A (amplitude), B (period), C (shift), D (midline) in y = A·sin(B(x − C)) + D.
- Prepare worked examples for tides, daylight, and temperature.
Facilitator note
This lesson is written to the learner (“you”). The idea to land: from real repeating data, amplitude = (max − min)/2, midline = (max + min)/2, and the period is the time between repeats — then choose A, B, C, D so the wave lands on the data. Teach the three reads explicitly — amplitude, midline, period — then assemble the model, with worked examples and guided practice (S-011).
The environment lens: tides and day length are the planet’s own periodic signals, felt on every coast and at every latitude. The intellectual lens: a handful of measurements (high, low, repeat time) encode a whole cycle. The critical-thinking lens: learners test the fitted model at a data point and ask “does it land where the real value is?” The technology lens: sound, alternating current, radio, and screens all carry information on sine waves — the same four features describe the signals inside every device. Distinguish the model (a good fit) from the reality (the world is messier than the curve). Preview: Lesson 9 turns to logarithms.
Procedure
- Recall (5 min). From Lesson 7, what do A, B, C, D each do? Today we find them from real data.
- The three reads (15 min). For repeating data:
- Amplitude = (maximum − minimum)/2.
- Midline = (maximum + minimum)/2.
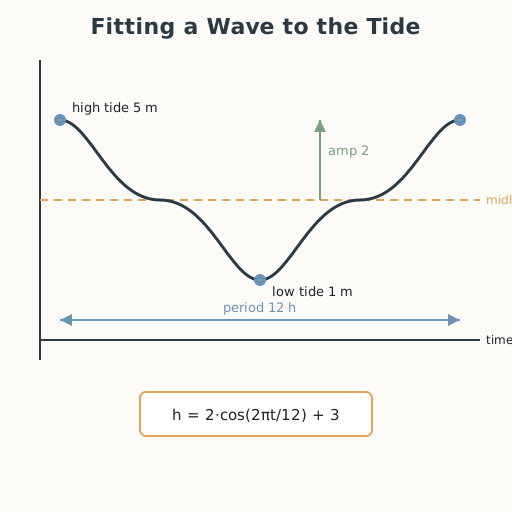
- Period = the time from one peak to the next; then B = 2π/period. Worked example (tides): high tide is 5 m, low tide is 1 m, and the tide cycles every 12 hours. Amplitude = (5 − 1)/2 = 2; midline = (5 + 1)/2 = 3; period = 12 h, so B = 2π/12. A model is h(t) = 2·cos(B·t) + 3 (cosine, since it starts at a peak).
- Fit daylight (12 min). A place’s longest day is 16 hours, its shortest 8 hours, repeating yearly. Amplitude = 4, midline = 12, period = 365 days. A model for day length is d(t) = 4·cos(2π·t/365) + 12. Note: daylight varies with latitude, and near the equator it barely changes at all — the model depends on where you live.
- Fit temperature (8 min). A place’s warmest month averages 27°C, its coldest 7°C, yearly. Amplitude = 10, midline = 17, period = 12 months. Write the model.
- Guided practice (10 min). With a partner: (a) a tide cycles 2 m to 6 m every 12 hours — find amplitude, midline, period, and write the model; (b) test it at the known high point; (c) say how the model would change near the equator.
- Close (5 min). Say how you find amplitude and midline from a high and a low, and name one real rhythm this lets you predict.
Differentiation
- Support: Work with cosine only (starting at a peak) and whole-number maxima and minima.
- Extension: Include a phase shift by modeling data that starts between a peak and a trough, and compare sine vs cosine fits.
Assessment
- Formative (peer + self): Can the learner read amplitude, midline, and period from real high/low data, write a sine/cosine model, and test it at a data point?
- Portfolio artifact (unit): The tide or daylight model, added to the pattern toolkit.
Home connection
Record one repeating thing near home for a few readings — the position of the Sun’s shadow at the same hour over several days, or the level of a stream. Estimate its high, low, and repeat time, and sketch the wave.
Resources
- On worked examples and guided practice: Kirschner, Sweller & Clark (2006), https://doi.org/10.1207/s15326985ep4102_1 (S-011).
- On periodic motion and its sine/cosine models: OpenStax, Algebra and Trigonometry and College Physics (S-435).