Lesson 16 — Critiquing Sampling, Bias, and Conclusions
Learners turn the design skills of Lesson 15 into a critical lens: they run a five-question checklist on real surveys and experiments to expose sampling bias, leading questions, confounding, and overgeneralized or causal-sounding conclusions. They practice reading numbers as citizens, not just as students.
Objectives
Objectives
- D05.S4.11.02 Design and carry out a survey or experiment, and critique the sampling, bias, and conclusions it produces.
Essential question
How do I critique a survey or experiment — its sampling, its bias, and the conclusions it claims — so I am not fooled by a number?
Key vocabulary
Materials
Standard materials
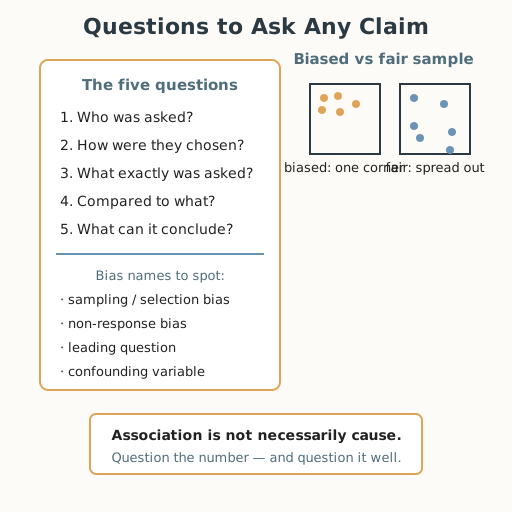
- Critique worksheet · 1 per learner A checklist of questions to ask any claim: who, how chosen, what asked, compared to what, and what can it actually conclude
- Math journal · 1 per learner
- Real headlines or ads (print or recalled) · 2–3 per group
Low-tech / no-cost
- Paper and pencil Run the critique checklist on a claim heard aloud or recalled from memory
- A spoken claim Have a partner state a claim, then question it with the checklist
Enriched / lab & device
- Access to a news or social feed (optional) · 1 per group To find a live claim and critique its sampling and conclusions
Works in different contexts
- large-group Critique one headline whole-class with the checklist, then groups critique two more in pairs
- multi-age Younger learners ask "who was asked?"; older learners run the full checklist and name the bias type
- self-directed A learner works through the checklist alone on a real claim and writes the verdict
- level-grouped Group by comfort with data vocabulary; a ready group distinguishes correlation from causation in a claim
- outdoor-only Critique a real-world claim visible locally — a sign, a notice, a market claim — with the checklist
Lesson 16 — Critiquing Sampling, Bias, and Conclusions
Summary
Learners turn design into critique: they run a five-question checklist on real surveys and experiments to expose sampling bias, leading questions, confounding, and overgeneralized or falsely causal conclusions. They practice reading numbers as citizens — questioning who was asked, how, and what the result can actually claim.
Objectives
- Critique a survey or experiment’s sampling, bias, and conclusions, and distinguish what its data can and cannot support. (D05.S4.11.02)
Connection
A number sounds certain: “78% agree,” “the new method works.” But behind every percentage is a choice about who was asked, how they were chosen, what exactly was asked, and what the result was compared to. Reading those choices is the difference between being informed and being fooled. It is a skill for everyone — for reading ads, news, and public claims about health, money, and the environment.
Materials
- Critique worksheet
- Real headlines or ads (print or recalled)
- Math journal
Preparation
- Copy or draw the critique worksheet.
- Retrieval: from Lesson 15, population, sample, random vs convenience sampling, treatment vs control.
- Gather 2–3 real claims (headlines, ads, or recalled claims) to critique.
Facilitator note
This lesson is written to the learner (“you”). The ideas to land: a claim is only as strong as its design — ask who was sampled, how they were chosen, what was asked, what the comparison is, and what the data can actually conclude (a survey shows association, not necessarily cause). Teach the five-question checklist explicitly, then let learners apply it to real claims (S-011). Bias names (selection, non-response, confirmation) and the guardrail of random sampling are standard (S-242, S-250).
The critical-thinking lens: this is the unit’s capstone habit — question the answer, but question it well. The ethics lens: a misleading number can be a small dishonesty with large consequences; reading honestly is an ethical act. The egalitarianism lens: claims that leave a group out speak for fewer people than they seem to — critique is a fairness tool. The environment lens: environmental claims (who pollutes, who is harmed) live or die by their sampling — reading them honestly matters for the planet. Distinguish the method (evidence) from the motive (values). Preview: this closes the unit’s data thread; the portfolio gathers all four strands.
Procedure
- Recall (5 min). From Lesson 15, what makes a sample fair and a question honest? Today we use that to judge other people’s numbers.
- The five-question checklist (15 min). For any claim, ask:
- Who was asked? (population)
- How were they chosen? (random, stratified, or convenience → bias?)
- What exactly was asked? (leading or neutral?)
- Compared to what? (is there a control or baseline?)
- What can it actually conclude? (association is not necessarily cause.) Worked example: “9 out of 10 dentists prefer Brand X.” Who asked them? How chosen? Prefer for what? Compared to what brand? Does “prefer” mean it is better?
- Name the bias (12 min). Sampling bias (the sample is not the population); selection bias (who got included); non-response bias (who refused to answer); a leading question (wording pushes an answer); a confounding variable (a third thing explains the link). Match each to a mini-example.
- Correlation is not causation (8 min). Two things moving together does not mean one causes the other. Worked example: ice-cream sales and drownings both rise in summer — the confounder is warm weather, not ice cream.
- Critique a real claim (12 min). In pairs, run the checklist on a real headline or ad, name the bias you find, and write one sentence about what the data can and cannot support.
- Close (3 min). Say the five questions from memory, and name one place you will use them this week.
Differentiation
- Support: Use only questions 1 and 2 (“who, and how chosen”) on simple claims first.
- Extension: Find a claim that sounds causal, identify the confounding variable, and rewrite the conclusion honestly.
Assessment
- Formative (peer + self) + performance: Can the learner run the five-question checklist on a claim, name the bias present, and state what the data can and cannot conclude?
- Portfolio artifact (unit): The critique worksheet with the rewritten conclusion, added to the data toolkit and reviewed at the unit capstone.
Home connection
Bring one claim from home or the wider world this week — a food label, an ad, a news line — and run the five questions on it. Write the verdict in one sentence.
Resources
- On worked examples and guided practice: Kirschner, Sweller & Clark (2006), https://doi.org/10.1207/s15326985ep4102_1 (S-011).
- On bias and its guardrails: BBC Bitesize, “Bias in science” (S-242); Understanding Science (UC Berkeley), “What is science? / bias” (S-250); on data used for justice: W. E. B. Du Bois’s Data Portraits (S-432).