Lesson 15 — Designing a Survey or Experiment
Learners design a survey or experiment: they choose a population and a fair sampling method (random or stratified, not convenience), write a clear, unbiased question, and plan an experiment with treatment and control. They actually run a small one and record the method, ready to critique it next lesson.
Objectives
Objectives
- D05.S4.11.02 Design and carry out a survey or experiment, and critique the sampling, bias, and conclusions it produces.
Essential question
How do I design a fair survey or experiment — choosing a population, a sample, and a method that answers the question honestly?
Key vocabulary
Materials
Standard materials
- Design worksheet · 1 per learner A template for planning a survey or experiment: question, population, sample, method, and what to record
- Math journal · 1 per learner
Low-tech / no-cost
- Paper slips and a container Draw names at random to feel what random sampling means
- Voice and a clipboard or notebook Run a small in-class survey with no devices at all
Enriched / lab & device
- Spreadsheet or survey tool · 1 per group To collect and tally responses quickly
- Random number generator (calculator or app) · 1 per group To select a genuinely random sample
Works in different contexts
- large-group Design one survey whole-class, then small groups each run a mini-survey and tally results
- multi-age Younger learners ask one clear question and tally by hand; older learners plan the sample and method formally
- self-directed A learner follows the design template alone, runs a small survey, and records the method
- level-grouped Group by comfort with data; a ready group plans a simple controlled experiment with treatment and control
- outdoor-only Survey a real, visible population — plants along a path, stones in a field, people at a market — with a hand tally
Lesson 15 — Designing a Survey or Experiment
Summary
Learners design a fair survey or experiment: they choose a population and a sampling method (random or stratified, not convenience), write a clear, unbiased question, and plan an experiment with treatment and control groups. They actually run a small one and record the method, ready to critique it next lesson.
Objectives
- Design a survey or experiment, choosing a population, sampling method, and question or treatment that answers a real question honestly. (D05.S4.11.02)
Connection
Every poll, every “9 out of 10 people agree,” every study you read is only as good as its design. If you ask only your friends, or phrase the question to push one answer, your result describes your friends and your phrasing — not the truth. Designing honestly means deciding who you are asking, how you choose them, and what exactly you ask — before you collect a single answer.
Materials
- Design worksheet
- Math journal
Preparation
- Copy or draw the design worksheet.
- Retrieval: from Grade 10, data summaries and the idea that samples should represent a population (D05.S4.09.01).
- Prepare a worked example design and materials for a quick in-class run.
Facilitator note
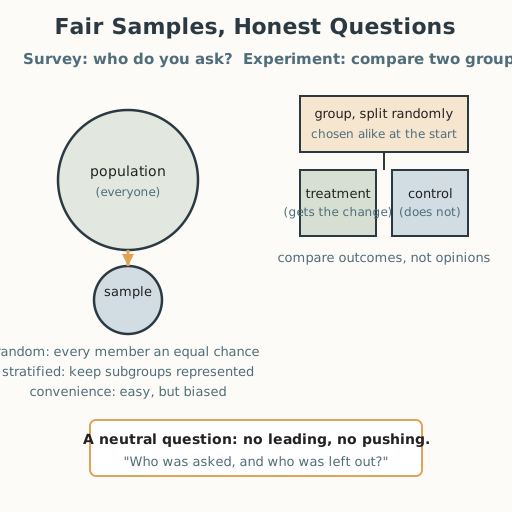
This lesson is written to the learner (“you”). The ideas to land: a population is the whole group; a sample is the part you study; random sampling gives every member an equal chance (reducing bias), stratified sampling keeps important subgroups represented, and convenience sampling is easy but biased; an experiment compares a treatment group against a control group. Teach the who → how → what design loop explicitly, with a worked example and guided practice (S-011). Random selection and blind measurement are among the standard guardrails against bias (S-242, S-250).
The egalitarianism lens: a fair sample includes everyone on the same footing — a survey that leaves a group out speaks for fewer people than it claims. The intellectual lens: design decides what the data can and cannot say. The critical-thinking lens: learners ask “who was asked, and who was left out?” before believing any percentage. The ethics lens: a leading question or a hidden agenda is a small dishonesty that corrupts the whole result. Preview: Lesson 16 turns the same eye on other people’s surveys and conclusions.
Procedure
- Recall (5 min). From Lesson 14, what does a sample tell you about a whole population? Today we decide how to choose the sample.
- The who and the how (15 min). The population is everyone the question is about; the sample is who you actually ask. Random sampling gives every member an equal chance; stratified sampling samples each important subgroup in proportion; a convenience sample (whoever is easy to reach) is fast but biased. Worked example: to know a school’s favorite lunch, asking only the first ten people in line is convenience sampling; drawing names from the full roll is random.
- The what: a clear question (10 min). A good question is neutral and specific. “Don’t you agree the park should stay?” leads; “Should the park stay open, close, or change?” is neutral. Write the question so it cannot push one answer.
- Experiment: treatment and control (10 min). An experiment compares a treatment group (who get the change) against a control group (who do not), with the two groups chosen alike. Worked example: does a study routine help? Half the learners (chosen randomly) use the routine; half keep their usual one; compare the results.
- Run a small one (12 min). In pairs, design and run a mini-survey or mini- experiment in the room: name the population, choose the sample randomly, ask one neutral question, and tally the answers. Record the method on the worksheet.
- Close (3 min). Say what makes a sample fair and a question honest, in one sentence each.
Differentiation
- Support: Design only a survey with one clear question and a named population; use a hat to draw the sample.
- Extension: Design a controlled experiment with randomization, a treatment, a control, and a plan to reduce observer bias (blind measurement).
Assessment
- Formative (peer + self) + performance: Can the learner name a population, choose a fair sampling method, write a neutral question, and (for an experiment) set up treatment and control groups — demonstrated by running a small one?
- Portfolio artifact (unit): The completed design worksheet, added to the data toolkit.
Home connection
Notice one claim in daily life (“everyone loves…”, “9 out of 10…”) and write down who might have been asked, and who might have been left out.
Resources
- On worked examples and guided practice: Kirschner, Sweller & Clark (2006), https://doi.org/10.1207/s15326985ep4102_1 (S-011).
- On sampling and randomization as guardrails against bias: BBC Bitesize, “Bias in science” (S-242); Understanding Science (UC Berkeley), “What is science? / bias” (S-250).