Lesson 02 — Industrialization: Weighing Gains and Losses
Learners analyze industrialization as one long-term transformation, weighing what was gained and lost for different peoples and the environment rather than telling it as a single triumph. They learn that a transformation's gains and losses fall *unevenly* — some prosper, others are displaced, and the land and air carry costs too (S-006, S-304). The skill practiced is the unit's core move: a balance-sheet of change that names *for whom*.
Objectives
Objectives
- D08.S1.11.01 Analyze one long-term transformation, such as industrialization or the recent acceleration of human impact, and weigh what was gained and lost for different peoples and the environment.
Essential question
How do I weigh what industrialization gained and what it lost, for different peoples and the environment?
Key vocabulary
Materials
Standard materials
- Gains-and-losses chart · 1 per learner Three columns — "for whom?", "gained", "lost" — to weigh a transformation
- History journal · 1 per learner
Low-tech / no-cost
- Chalk or stick on ground Draw the three-column chart on any flat surface
Enriched / lab & device
- Our World in Data emissions charts (if a screen is available) To show the long rise of fossil-fuel emissions from the industrial era (S-006)
Works in different contexts
- large-group Model the weigh-in on one example whole-class, then pairs weigh two further peoples and share out
- multi-age Younger learners sort "gained/lost" cards; older learners write the "for whom" and "why" reasoning
- self-directed A learner completes the chart alone and checks it against the worked example before writing a summary judgment
- level-grouped A ready group reads about industrial pollution and the peppered moth (S-304) and adds an environmental row
- outdoor-only Use the chart on the ground; a "smoke" and a "clean air" card stand for the environment's row
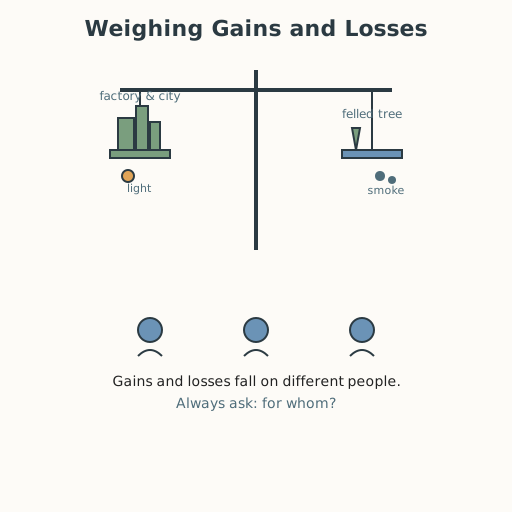
Lesson 2 — Industrialization: Weighing Gains and Losses
Summary
Industrialization — the shift to machine-made goods, factories, and cities, powered in large part by coal and oil — transformed human life over the last two and a half centuries. It brought gains (cheaper goods, new medicine, faster travel) and losses (displacement, dangerous work, polluted air and water), and those gains and losses did not fall evenly. Learners build a “gains-and-losses” chart that always asks for whom?, and meet the peppered moth as a small, real sign of industrialization’s environmental reach (S-304).
Objectives
- Analyze industrialization as a long-term transformation and weigh what was gained and lost for different peoples and the environment. (D08.S1.11.01)
Connection
The phone or cloth or bicycle near you was almost certainly made in a factory far away, then carried across the world by fossil-fueled transport. That single object is a thread connecting you to industrial work, to shipping, and to the air that the making of it touched. “Gain” and “loss” are not abstract — they live inside everyday things.
Materials
- Gains-and-losses chart
- History journal
Preparation
- Copy or draw the three-column chart (“for whom? | gained | lost”).
- Retrieval: from Grade 10, the Columbian Exchange and the growth of global trade (S-273), and from earlier grades how a tool or technology changes how people live.
- Prepare the worked example (step 2) and the moth card (step 5).
Facilitator note
Teach the skill explicitly — a balance-sheet of change with a “for whom?” column — then guide practice (S-011). The egalitarianism lens is central: a transformation is not one experience but many, and naming who gained and who was left out is the honest way to tell it. The environment lens: industrialization drew on coal and oil and changed air, land, and water; fossil-fuel emissions have risen sharply since the industrial era began (S-006). The technology lens: machines and energy are tools whose benefits and burdens travel unevenly. The global lens: industrialization did not happen the same way or at the same time everywhere, and its first centers do not tell the whole story. Do not teach a single nation’s triumph; teach a many-voiced, many-costed change.
Procedure
- Recall (5 min). From earlier grades: what did the Columbian Exchange move, and what happened when new plants and animals crossed oceans? (S-273) Today we study a later, faster exchange: machines and fossil energy.
- Meet the weigh-in (10 min). Industrialization = the shift to machines, factories, and cities. Worked example on the chart: for factory owners, gained wealth and power; for mill workers, gained wages but lost health and time; for the air and river, lost — smoke and waste. Note the “for whom?” column doing the work.
- Weigh more peoples (15 min). With a partner, add rows: children who worked mills; farmers pushed off common land into cities; families who could finally buy cheap cloth; people in distant colonies who supplied raw cotton and bought back finished cloth. For each, fill “gained” and “lost.”
- The environment’s row (8 min). Add a row for the environment. Coal smoke darkened industrial cities. In England, the peppered moth’s dark form became common in sooty air, then declined again as the air was cleaned — a small, real trace of industrialization written on living things (S-304).
- Write the judgment (12 min). In your journal, answer: Was industrialization more gain or more loss? First say “for whom,” then give your reasoned judgment — evidence for gains, evidence for losses, and who carried each.
- Close (5 min). Share one “for whom” row that surprised you. Preview: next lesson turns to the recent acceleration of human impact on the whole Earth.
Differentiation
- Support: Provide pre-filled “gained/lost” cards to sort under each “for whom?” heading before writing.
- Extension: Compare industrialization in two regions (e.g., a European textile center and a colony that supplied its cotton) and note how the same machine produced opposite experiences.
Assessment
- Formative (peer + self): Does the chart name for whom each gain and loss fell, including the environment, and does the judgment weigh both sides with evidence?
- Portfolio artifact (unit): The completed gains-and-losses chart plus the written judgment, as the first long-transformation analysis.
Home connection
Choose one everyday object at home. Trace it back one step — where was it made, what power likely ran the factory, how far did it travel? List one gain and one loss of its journey.
Resources
- Fossil-fuel (CO₂) emissions documented since 1751, and the pattern that historical emitters differ from present emitters: Our World in Data (S-006).
- Industrial pollution and the peppered moth (Biston betularia): Kettlewell (1955) and later refinements (S-304).
- Explicit instruction and worked examples for novice skills: Kirschner, Sweller & Clark (2006) (S-011).
- The Columbian Exchange as the earlier global movement of plants, animals, and people: Crosby (1972) (S-273).