Lesson 03 — The Great Acceleration: Human Impact on the Earth
Learners analyze the recent *acceleration* of human impact on the Earth — the sharp post-industrial climb in population, energy use, and emissions — as a second long-term transformation to weigh. They meet the ecological footprint as a way of comparing what people use with what the Earth renews (S-277), and carrying capacity as a limit an environment can sustain (S-436), while weighing what the acceleration has gained for human well-being and what it has cost the living Earth and the least-advantaged.
Objectives
Objectives
- D08.S1.11.01 Analyze one long-term transformation, such as industrialization or the recent acceleration of human impact, and weigh what was gained and lost for different peoples and the environment.
Essential question
How do I weigh what the recent acceleration of human impact has gained and lost, for peoples and the living Earth?
Key vocabulary
Materials
Standard materials
- Curve-plotting sheet · 1 per learner Blank axes to sketch the long, slow rise and the recent sharp climb of human impact
- History journal · 1 per learner
Low-tech / no-cost
- A stretched string and knots Knots spaced wide (early history) then suddenly close (the acceleration) to feel the change in pace
Enriched / lab & device
- Our World in Data or Global Footprint Network charts on a screen To view real curves of population, energy, and footprint (S-006, S-277)
Works in different contexts
- large-group Sketch one shared curve on the board, then pairs sketch a second (energy or water) and compare shapes
- multi-age Younger learners pace out the knots/string; older learners read and interpret a real curve and its units
- self-directed A learner plots the curve from given data points and writes what the shape means
- level-grouped A ready group reads the ecological-footprint and carrying-capacity definitions (S-277, S-436) and connects them
- outdoor-only Walk the acceleration — long slow strides for early history, then sudden short steps for the recent climb
Lesson 3 — The Great Acceleration: Human Impact on the Earth
Summary
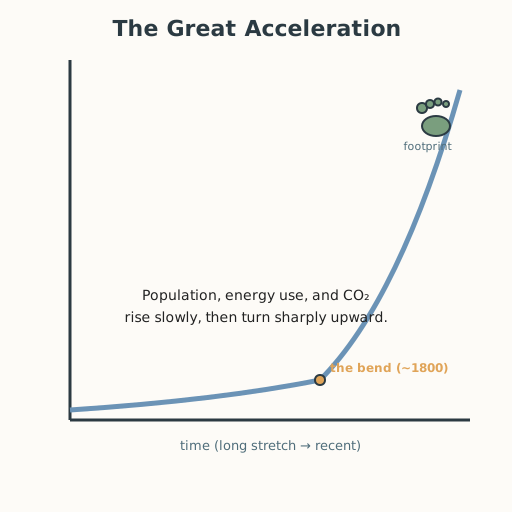
For most of human history, population and resource use grew slowly. In the last two centuries the pace turned sharply upward — more people, more energy, more goods, more carbon in the air (S-006). Scientists call this recent surge the Great Acceleration. Learners sketch this curve, meet the ecological footprint (how much nature a person or people uses versus how much is renewed, S-277) and carrying capacity (the largest population an environment can sustain, S-436), and weigh the acceleration’s gains and losses just as they did for industrialization.
Objectives
- Analyze the recent acceleration of human impact as a long-term transformation and weigh what was gained and lost for different peoples and the environment. (D08.S1.11.01)
Connection
Look at a family photograph from two generations ago: fewer cars, fewer plastic things, dimmer nights, slower travel. Now look at today. That change of pace is the acceleration — the same curve that lifted many out of want also pushed the Earth’s systems, and not everyone climbed at the same time or to the same height.
Materials
- Curve-plotting sheet
- History journal
Preparation
- Copy the curve-plotting sheet; prepare data points for the sketch (step 3).
- Retrieval: from Lesson 2, the gains-and-losses weigh-in for industrialization.
- Prepare the footprint and carrying-capacity definitions (S-277, S-436).
Facilitator note
Keep this honest and hopeful, never despairing: the acceleration raised living standards for many and strained Earth systems, and the two truths sit side by side. The environment lens: fossil-fueled growth changed the atmosphere, and the curve of CO₂ since 1751 is real (S-006). The egalitarianism lens: the people who emitted least over history are often those most exposed to the consequences (S-006), and footprints are very unequal between and within countries. The technology lens: energy and machines are the engine of the curve — tools, not fate. The global lens: the acceleration is planetary, but its pace and its burdens differ by region. Connect the facts to agency: choices about energy and use are still open.
Procedure
- Recall (5 min). From Lesson 2: name one gain and one loss of industrialization. Today we zoom out to the whole Earth’s pace of change.
- Feel the acceleration (8 min). Stretch a string. Place knots far apart for the long, slow stretch of early history, then suddenly close together for the last two centuries. What does the crowding of knots feel like compared to the wide spacing?
- Sketch the curve (12 min). On your axes, plot a line that is nearly flat for a long stretch, then turns sharply upward: population, energy use, and CO₂ all bend upward after about 1800 (S-006). Label the flat part and the climb.
- Meet footprint and carrying capacity (12 min). The ecological footprint measures how much nature a person or people use against how much the Earth can renew (S-277). Carrying capacity is the largest population an environment can sustain (S-436). Discuss: what happens when a footprint is bigger than what renews?
- Weigh gains and losses (12 min). In your journal, answer with a “for whom?” column: the acceleration gained — longer lives, more food, more learning for many; lost — strained atmosphere, oceans, and soils, and an unequal share of both the gains and the harms.
- Close (6 min). Share one hope: one choice people can still make about energy or use that bends the curve.
Differentiation
- Support: Work only with the knot-string and one simple curve (population); put the footprint idea in one sentence.
- Extension: Read one real footprint or emissions chart and interpret its units and its “for whom” pattern (S-006, S-277).
Assessment
- Formative (peer + self): Can the learner describe the curve’s shape and name one gain, one loss, and who carries each?
- Portfolio artifact (unit): The plotted curve with the “for whom?” weigh-in, added to the transformation analysis begun in Lesson 2.
Home connection
Count one day’s energy use at home — lights, cooking, travel, devices. Sketch your family’s small share of the acceleration’s curve and note one choice that could change its slope.
Resources
- The long rise of fossil-fuel (CO₂) emissions and who emitted versus who is exposed: Our World in Data (S-006).
- The ecological footprint as a measure of how much nature we use versus how much there is: Global Footprint Network (S-277).
- Carrying capacity as the maximum population an environment can sustain: Encyclopaedia Britannica (S-436).
- Climate-system science and the human strengthening of the greenhouse effect: IPCC (S-005).