Lesson 13 — Making a Picture Graph
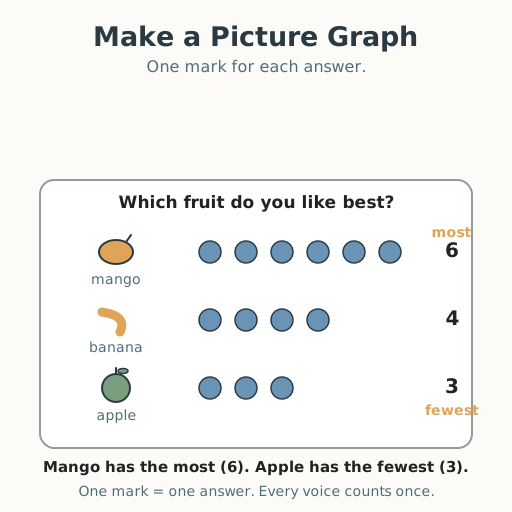
Learners ask a real question, collect answers from the group, and build a picture graph — one object or mark per answer. They read what it shows: which answer has the most, which the fewest, and how many each, turning scattered voices into a picture everyone can agree on.
Objectives
Objectives
- D05.S4.01.01 Collect and organize data into a simple chart or picture graph and answer questions about what it shows.
Essential question
How do I collect answers to a question, show them in a picture graph, and read what the graph says?
Key vocabulary
Materials
Standard materials
- A simple survey question and way to record answers · 1 One question the whole group can answer (favorite fruit, how we get to school, pets at home)
- Small pictures, marks, or objects to place · 1 per learner One picture, seed, or stone per learner to place in the graph
- A large chart surface · 1 A grid on paper, cloth, or the ground with rows for each answer
Low-tech / no-cost
- Found objects and the ground Build the graph on the ground with one stone, seed, or leaf per learner placed in rows
- Tally marks in the dirt Record each answer with a tally mark drawn with a stick
Enriched / lab & device
- Picture cards for a pictograph · 1 set Printed small pictures to place one per answer in a neat picture graph
- A sticky-note or token wall chart · 1 A chart where each learner places one token or note in the row for their answer
Works in different contexts
- large-group The whole class answers one question, each learner placing one object in the graph, then the group reads it together
- self-directed A learner asks a question of their family or a small group, records answers as marks, builds a picture graph, and answers questions about it
- outdoor-only Build a living graph outdoors — each learner stands in a row for their answer — then count each row
- multi-age Older learners write the question and count the rows while younger learners place their object and read the biggest and smallest rows
Lesson 13 — Making a Picture Graph
Summary
Learners ask a real question, collect answers from the whole group, and build a picture graph — one object or mark for each answer, arranged in rows. Then they read what it shows: which answer has the most, which the fewest, and how many each, turning many small voices into one picture everyone can agree on.
Objectives
- Collect and organize data into a simple chart or picture graph and answer questions about what it shows. (D05.S4.01.01)
Connection
A village elder wants to know which crop the farmers planted most so the storehouse can prepare; a family wants to know which meal everyone likes best; a teacher wants to know how each child comes to school. When you ask everyone the same question and put one mark for each answer in a row, you make a picture graph — and suddenly the answer is easy to see. Turning voices into a picture is how people make decisions together, fairly.
Materials
- A simple survey question and a way to record answers
- One small picture, mark, seed, or stone per learner
- A large chart surface (paper, cloth, or the ground)
Preparation
- Choose one question everyone can answer (a favorite fruit, how we get to school, a pet at home).
- Prepare a chart with one row for each possible answer.
- Give each learner one object or mark to place.
Facilitator note
This lesson is written to the learner (“you”). It spirals up from Kindergarten’s “sort into groups” to collecting data and building a picture graph — the new skill. Teach with a worked example (philosophy §13): ask the question, place the first few objects in rows together, then let each learner add theirs. The powerful ideas are one object per answer and reading the graph — most, fewest, and how many. Frame the graph as a fair way to hear everyone: each person’s answer counts once, and no answer is more important than another (egalitarianism). Choose a question that is respectful and has no “right” answer. For learners who are Deaf or hard of hearing, pose the question in sign or pictures and let learners place their object; for learners who are blind or low-vision, build a tactile graph — objects in rows the hands can count. A learner who does not speak places their object or points to their answer. Every answer is one mark, and every mark matters equally.
Procedure
- Gather — a question for everyone (5 min). Today we ask one question of everyone and turn the answers into a picture. Here is our question: ___ (for example, “Which fruit do you like best?”).
- Worked example — place the first marks (10 min). Watch and help: the chart has a row for each answer. The first few learners place one object in their answer’s row. Notice: one object for one person — that is the rule that keeps the graph fair.
- Collect everyone’s answer (10 min). Each learner places one object in the row for their answer. When everyone has placed theirs, the graph is complete. Look at it: each row is a pile you can count.
- Read the graph (10 min). Count each row. Which answer has the most? Which has the fewest? How many people chose each one? Are any rows the same number? Answer the question together.
- Ask new questions (7 min). What else can the graph tell us? How many people answered in all? How many more chose the top answer than the bottom one? Wonder about it together.
- Close (3 min). You asked a question, collected answers, and made a picture everyone could read. Data is just people’s answers, made fair and clear — one mark for each voice.
Differentiation
- Support: Use only two answer choices and count the rows together, touching each object.
- Support (blind/low-vision): Build the graph with objects in rows and read it by feeling and counting each row.
- Extension: Draw the picture graph on paper with one drawn mark per answer, and write a sentence about what the graph shows.
Assessment
- Formative (observation): Can the learner place one object per answer to build a picture graph and answer questions about which has the most, the fewest, and how many?
- Artifact (portfolio): The completed picture graph (or a drawing of it), kept as a record of the learner’s data work.
Home connection
At home, ask everyone the same question (“which color do you like best?”), put one mark or object for each answer in a row, and tell a grown-up which row has the most.
Resources
- National Research Council. (2009). Mathematics Learning in Early Childhood: Paths Toward Excellence and Equity. The National Academies Press. (Early data collection and representation with real objects and picture graphs.)