Lesson 07 — Plotting Points and Relationships on a Grid
Learners plot points in the first quadrant of a coordinate grid using ordered pairs, naming the x-axis, y-axis, and origin. They plot sets of points that follow a pattern and notice the relationship between x and y, such as a doubling relationship (1,2), (2,4), (3,6).
Objectives
Objectives
- D05.S2.05.01 Plot points and graph relationships in the first quadrant of a coordinate grid to represent real situations.
Essential question
How do I plot points on a coordinate grid, and how does a set of points show a relationship?
Key vocabulary
Materials
Standard materials
- First-quadrant coordinate grid · 1 per pair A grid numbered 0 to 6 on both axes with labeled x-axis, y-axis, and origin
- Point-plotting cards · 1 set per group Ordered pairs to plot, some that follow a growing pattern
- Grid recording page · 1 per learner A page with blank first-quadrant grids for plotting points and noticing patterns
Low-tech / no-cost
- A chalk or dirt grid Draw a grid on the ground or a wall; walk or place stones at points, counting steps along each axis
- Body coordinates One axis is "steps forward," the other "steps right"; a learner walks to the point for a partner to name
Enriched / lab & device
- A digital graphing tool · 1 per group A coordinate tool that plots points and connects them, where devices allow
- A real map with grid squares · 1 per group A street or field map overlaid with grid lines to find places by coordinates
Works in different contexts
- large-group Plot points together on a big grid, then have pairs plot a pattern and describe the relationship they see
- multi-age Younger learners name and plot single points while older learners describe the pattern in a set of points
- self-directed A learner plots points from cards alone, checks their places, and describes any pattern in the set
- level-grouped Learners ready to extend predict the next point in a pattern and explain the rule connecting x and y
- outdoor-only Use a chalk grid on the ground and walk to points, counting steps along each axis to reach the ordered pair
Lesson 7 — Plotting Points and Relationships on a Grid
Summary
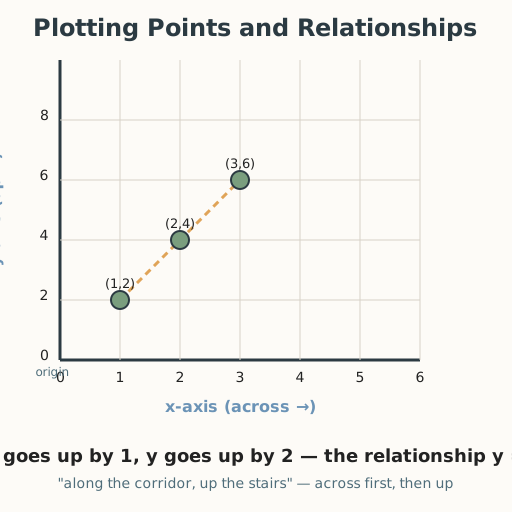
Learners plot points in the first quadrant of a coordinate grid using ordered pairs, naming the x-axis, y-axis, and origin. They plot sets of points that follow a pattern and notice the relationship between x and y, such as a doubling relationship — (1,2), (2,4), (3,6).
Objectives
- Plot points in the first quadrant of a coordinate grid and use the points to describe a relationship between two quantities. (D05.S2.05.01)
Connection
A gardener plants seedlings and records, week by week, how tall they grow: week 1 → 2 units high, week 2 → 4, week 3 → 6. If we draw a grid and put weeks along the bottom (x) and height up the side (y), the points climb in a line — and that line tells the whole story at a glance. Coordinate grids are how mapmakers, builders, farmers, and scientists pin down where something is and how two things grow together, all over the world.
Materials
- First-quadrant coordinate grid
- Point-plotting cards
- Grid recording page
Preparation
- Copy coordinate grids for pairs and point-plotting cards for groups.
- Copy the recording page.
- Have examples ready: plot (2,3); plot the pattern (1,2), (2,4), (3,6).
Facilitator note
This lesson is written to the learner (“you”). The ideas to land: (1) the x-axis runs
across, the y-axis runs up, and they meet at the origin (0,0); (2) an ordered pair
(x, y) tells you to go across x first, then up y — “along the corridor, up the stairs”; and
(3) a set of plotted points can show a relationship (here, y is always double x). Model a
worked example first (plot (2,3) aloud: across 2, up 3), then guide a second (Kirschner,
Sweller & Clark, 2006). The most common slip is reversing the order — going up first. Retrieval:
ask learners to recall place-value and decimal skills and notice the grid’s coordinates are
whole numbers for now. Coordinates are evidence; the habit of reading a graph carefully rather
than guessing is a critical-thinking value (docs/philosophy.md §7). Coordinate grids trace to
René Descartes, but the idea of locating a place by two distances is far older and appears in
mapmaking traditions worldwide — a global point worth naming.
Procedure
- Gather (5 min). Think of a way to tell someone exactly where a spot is — on a map, a field, a game board. Today you learn the grid that does this with two numbers.
- Meet the grid (10 min). Look at the coordinate grid. The x-axis runs across the bottom, the y-axis runs up the side, and they meet at the origin (0,0). A point is named by an ordered pair (x, y): the first number says “go across,” the second says “go up.”
- Worked example (10 min). Plot (2,3). Start at (0,0). Go across 2 on the x-axis, then up 3. Mark the point. Remember: “along the corridor, up the stairs.”
- Notice a relationship (10 min). Plot (1,2), (2,4), (3,6). What pattern do you see? As x goes up by 1, y goes up by 2 — y is always double x. Connect the dots: they make a straight line.
- Practice with a partner (10 min). Take your point-plotting cards, plot each ordered pair, and check each other: did you go across first, then up? For the pattern cards, predict the next point.
- Close (5 min). A coordinate grid turns two numbers into a place, and a set of places into a picture of a relationship. Across first, then up — and you can read any map.
Differentiation
- Support: Use only whole-number points from 0 to 5; keep a large labeled grid and describe each move aloud. Use tactile grid lines so learners with low vision can follow by touch.
- Extension: Predict and plot the next points in the pattern (4,8), (5,10), and write the rule connecting x and y in words.
Assessment
- Formative (observation/self): Can the learner plot an ordered pair correctly (across first, then up) and describe a pattern in a set of points?
- Self-check: The learner asks, “Did I go across first and then up? Can I name the pattern that connects my points?”
Home connection
Find a grid in the world — a map, a game, a floor of tiles — and use two numbers to tell someone exactly where one spot is.
Resources
- First-quadrant coordinate plotting is standard in elementary mathematics; see John A. Van de
Walle, Elementary and Middle School Mathematics (10th ed., 2019). The note that locating a
place by two distances predates Cartesian coordinates and appears in global mapmaking is a
historical observation; treating all traditions as worthy is a value (
docs/philosophy.md§4).