Lesson 16 — Using Line-Plot Data to Solve Problems
This capstone lesson uses a line plot of fractional data to solve a set of problems that draw on the whole unit: adding fractions and decimals, comparing and rounding, converting units, finding volume, and using coordinates. Learners answer data questions, show their work, and reflect on how the unit's tools connect.
Objectives
Objectives
- D05.S4.05.02 Represent and interpret data on line plots with fractions and use the data to solve problems.
- D05.S1.05.01 Read, write, compare, and round decimals to the thousandths and connect them to fractions with denominators of 10 and 100.
- D05.S1.05.02 Add, subtract, multiply, and divide fractions and decimals in real contexts such as sharing, cooking, and money.
- D05.S2.05.01 Plot points and graph relationships in the first quadrant of a coordinate grid to represent real situations.
- D05.S2.05.02 Write and evaluate simple expressions and interpret what they mean in a real situation.
- D05.S3.05.01 Graph points in the first quadrant of a coordinate grid and use them to solve problems about location and distance.
- D05.S3.05.02 Find the volume of right rectangular prisms using unit cubes and formulas, and explain what volume measures.
- D05.S4.05.01 Convert among different-sized standard measurement units and use the conversions to solve real problems.
Essential question
How do I use line-plot data to solve problems, and how does it connect everything I learned this unit?
Key vocabulary
Materials
Standard materials
- Rainwater line plot · 1 A line plot of weekly rainwater collected in centimeters (fractional) over several weeks
- Data problem cards · 1 set per group Cards with questions about the line plot that call on the unit's skills — fractions, decimals, conversions, volume, and coordinates
- Capstone problem page · 1 per learner A page to record answers and show the work for each data question
Low-tech / no-cost
- A chalk or dirt line plot Draw the line plot in the dirt and answer questions using pebbles as X marks, computing aloud
- Real collected data Collect a real set of fractional measurements (rain, growth, distances) and solve the same kinds of questions with it
Enriched / lab & device
- A digital line-plot and calculator · 1 per group A line-plot tool and calculator to build the plot and check computations, where devices allow
- A class data fair · 1 A sharing of each group's data story and answers, displayed for the class to read and question
Works in different contexts
- large-group Solve the first data question together, then have groups work the remaining cards and share one finding with the class
- multi-age Younger learners find counts and the most common value while older learners compute totals, ranges, and converted amounts
- self-directed A learner works the capstone page alone, answering each data question and checking against the worked examples
- level-grouped Learners ready to extend write their own data question for the plot and solve it, then trade with a partner
- outdoor-only Use the dirt line plot and real collected measurements outdoors to answer the data questions together
Lesson 16 — Using Line-Plot Data to Solve Problems
Summary
This capstone lesson uses a line plot of fractional data to solve a set of problems that draw on the whole unit: adding fractions and decimals, comparing and rounding, converting units, finding volume, and using coordinates. Learners answer data questions, show their work, and reflect on how the unit’s tools connect. This lesson produces the unit’s line-plot data task as a portfolio artifact.
Objectives
- Represent and interpret data on a line plot with fractions and use it to solve problems. (D05.S4.05.02)
- Revisit the unit’s skills — decimals and fractions (D05.S1.05.01, D05.S1.05.02), coordinates (D05.S2.05.01), expressions (D05.S2.05.02), location and distance (D05.S3.05.01), volume (D05.S3.05.02), and measurement conversions (D05.S4.05.01) — while solving a data story.
Connection
A village keeps a rain gauge and records how many centimeters of rain fall each week, to the nearest eighth: 1/2, 5/8, 3/4, 1, and so on. The numbers pile up in a notebook — but a line plot turns them into a picture the whole village can read: which week was wettest, how much fell in all, and whether the tanks are full. Today you are the one who reads the picture and answers the village’s questions, using every math tool you have built this unit — because real problems rarely use just one skill at a time.
Materials
- Rainwater line plot
- Data problem cards
- Capstone problem page
Preparation
- Print or draw the rainwater line plot (fractional amounts in eighths).
- Copy data problem cards for groups and the capstone problem page.
- Have the unit’s conversion chart and volume formula on hand for reference.
Facilitator note
This is the unit capstone, written to the learner (“you”). The aim is to use a line plot
to solve problems while retrieving the unit’s skills (spacing and interleaving — the unit’s
spiral). Model the first data question as a worked example, then let groups work the rest
(Kirschner, Sweller & Clark, 2006). The questions are deliberately cross-cutting: a total
(fractions), a comparison (decimals/rounding), a conversion (units), a tank fill (volume), and a
location note (coordinates). Watch for learners reaching for one skill when a problem needs
another — that is the point of the capstone. This lesson produces the unit’s line-plot data
task for the portfolio. Keep it cooperative, never ranked (docs/philosophy.md §8). The
arithmetic is evidence; the care of reading data honestly so a community plans water fairly is a
value (docs/philosophy.md §4, §7).
Procedure
- Gather (5 min). For fifteen lessons you have built tools: decimals, fractions, the grid, volume, conversions, and line plots. Today you use them all to answer a real data story.
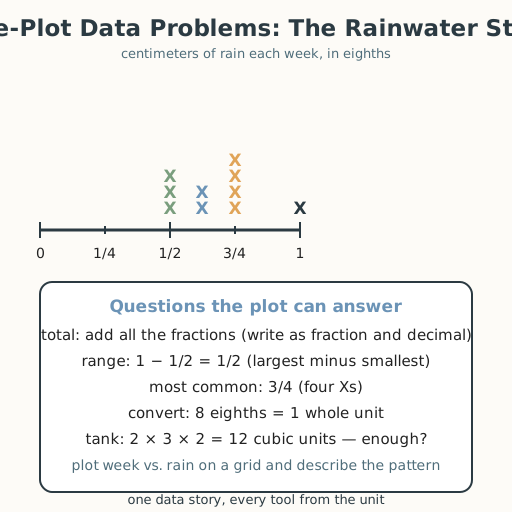
- Meet the plot (10 min). Look at the rainwater line plot. Read it: which amount is most common? What is the range (largest minus smallest)? How many weeks were measured?
- Worked example — find the total (10 min). To find how much rain fell in all, add the fractions: convert each to eighths, then add. Show each step and write the total as a mixed number and a decimal.
- Solve the data problems (20 min). With your group, work the problem cards: (a) the total rain (fractions and decimals); (b) compare two weeks and round to the nearest tenth; (c) convert the total to a smaller unit; (d) if a rectangular tank is 2 × 3 × 2 units, how many cubic units does it hold — is it enough for the total rain? (volume); (e) on a grid, plot the week number against its rain and describe the pattern (coordinates). Show all work.
- Close (5 min). Real problems use many skills at once. When you added, compared, converted, measured, and plotted, you were doing what mathematicians, farmers, and engineers do every day. Your line-plot task is the record of that work.
Differentiation
- Support: Answer only the total and the most-common questions; keep the conversion chart and volume formula visible and model each step aloud. Provide tactile versions of the plot for learners with low vision.
- Extension: Write an original question about the plot that uses two skills, solve it, and trade with a partner.
Assessment
- Summative (performance/portfolio): Does the learner read the line plot correctly and solve the data problems, showing the unit’s skills (fractions, decimals, conversion, volume, coordinates)?
- Self-check: The learner asks, “Did I choose the right tool for each question, and can I explain how the unit’s skills worked together?”
Home connection
Collect a small set of real measurements at home (rain, plant growth, distances) and make a line plot, then answer a “how much in all?” and a “what is most common?” question with your family.
Resources
- Line plots and the integration of the unit’s skills are standard in elementary mathematics;
see John A. Van de Walle, Elementary and Middle School Mathematics (10th ed., 2019). The
value of reading data honestly for a community’s fair planning is a commitment
(
docs/philosophy.md§4, §7).