Lesson 15 — Line Plots with Fractions
Learners make and read line plots that display fractional data. They place X marks above a number line for each measurement, then read the plot to find the most common value, the range (largest minus smallest), and the number of data points.
Objectives
Objectives
- D05.S4.05.02 Represent and interpret data on line plots with fractions and use the data to solve problems.
Essential question
How do I make and read a line plot that shows fractional data?
Key vocabulary
Materials
Standard materials
- Line-plot grid page · 1 per learner A page with a number line marked in eighths or quarters for building line plots
- Fractional measurement cards · 1 set per group Cards with fractional measurements (e.g., bean lengths 1/2, 3/4) to plot as X marks
- Line-plot reading page · 1 per learner A page with a line plot to read and answer questions about
Low-tech / no-cost
- A chalk or string number line Draw a number line in the dirt or lay a string, and place pebbles or marks at each fractional measurement
- Real objects to measure Measure real leaves, sticks, or seeds to the nearest fraction of a unit and plot the results with marks
Enriched / lab & device
- A digital line-plot tool · 1 per group A tool that builds a line plot from entered fractional data, where devices allow
- A class data collection · 1 Collect a real set of fractional measurements from the class and build a shared line plot
Works in different contexts
- large-group Build one line plot together from a shared data set, then have groups plot their own and answer questions
- multi-age Younger learners place whole-number marks while older learners place fractional marks and interpret the plot
- self-directed A learner builds a line plot from cards alone and answers reading questions, checking against the worked example
- level-grouped Learners ready to extend find the range (largest minus smallest) and combine all the fractions to find a total
- outdoor-only Measure real outdoor objects to the nearest fraction and build the line plot in the dirt with pebbles
Lesson 15 — Line Plots with Fractions
Summary
Learners make and read line plots that display fractional data. They place X marks above a number line for each measurement, then read the plot to find the most common value, the range (largest minus smallest), and the number of data points.
Objectives
- Represent fractional data on a line plot and interpret what the plot shows. (D05.S4.05.02)
Connection
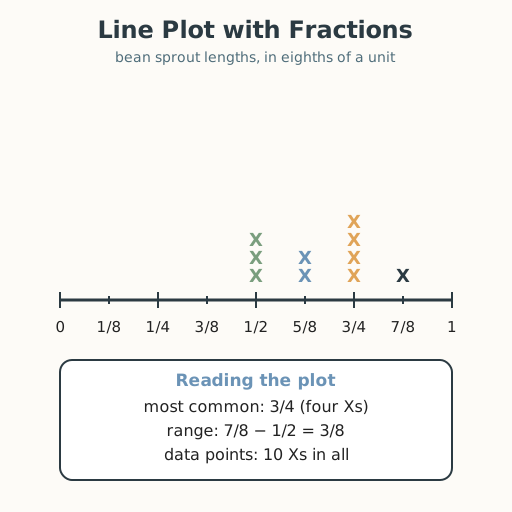
A class measures the lengths of ten bean sprouts to the nearest eighth of a unit: 1/2, 5/8, 3/4, and so on. If they write all ten numbers in a list, the pattern is hard to see. But if they draw a number line and put an X above each length, the picture appears instantly: most sprouts are around 3/4. A line plot turns a pile of numbers into a picture you can read — the same tool a weather station, a clinic, or a farmer uses to see what is common and what is rare.
Materials
- Line-plot grid page
- Fractional measurement cards
- Line-plot reading page
Preparation
- Copy line-plot grid pages and reading pages.
- Copy fractional measurement cards for groups.
- Have a worked example ready: plot lengths 1/2, 1/2, 1/2, 5/8, 5/8, 3/4, 3/4, 3/4, 3/4, 7/8.
Facilitator note
This lesson is written to the learner (“you”). The ideas to land: (1) a line plot shows each
data point as an X above a number line, so repeated values stack up; (2) the tallest stack
shows the most common value; (3) the range is largest minus smallest. Model building one plot
step by step as a worked example (Kirschner, Sweller & Clark, 2006), then guide a second. Common
slips: putting X marks between the marks instead of on them, and confusing “most common” with
“largest.” Retrieval: ask learners to recall the number line from Lesson 2 and the fraction work
from Lessons 4–6 and reuse them. Data display is evidence; the habit of showing data honestly —
every point, no hiding — is a critical-thinking and fairness value (docs/philosophy.md §4, §7).
Procedure
- Gather (5 min). Recall: how do you find which number is largest on a number line? Today you turn a list of fractional measurements into a picture — a line plot.
- Meet the line plot (10 min). A line plot is a number line with an X above the value for each piece of data. Repeated values stack up, so you can see at a glance what is common.
- Worked example — build (15 min). Together, plot these ten bean lengths (in eighths): 1/2, 1/2, 1/2, 5/8, 5/8, 3/4, 3/4, 3/4, 3/4, 7/8. Draw the number line from 0 to 1 in eighths. For each length, place one X above its mark. The tallest stack is at 3/4 (four Xs) — that is the most common length.
- Worked example — read (10 min). From the plot: the range is largest minus smallest = 7/8 − 1/2 = 7/8 − 4/8 = 3/8. There are 10 Xs, so 10 data points.
- Practice with a partner (10 min). Take your measurement cards, build your own line plot, and answer: which value is most common? What is the range? How many data points? Check each other: did every X land on the right mark?
- Close (5 min). A line plot is data made visible. One X per measurement, and the tallest stack tells you what is most common.
Differentiation
- Support: Use only halves and fourths; keep the number line large and place X marks with a finger. Describe the plot aloud and use tactile marks so learners with low vision can follow by touch.
- Extension: Combine all the fractions to find the total, and compare two line plots to say which has the greater total or range.
Assessment
- Formative (observation/self): Can the learner build a line plot from fractional data and identify the most common value and the range?
- Self-check: The learner asks, “Did I place one X per measurement on the right mark, and can I read the most common value and the range?”
Home connection
Measure several small things at home to the nearest fraction (leaves, paper strips, beans) and make a line plot of their lengths with someone at home.
Resources
- Line plots with fractions are standard in elementary mathematics; see John A. Van de Walle,
Elementary and Middle School Mathematics (10th ed., 2019). The value of honest, complete
data display is a commitment (
docs/philosophy.md§7).