Lesson 14 — Mean, Median, Mode, and Range: Choosing the Best Measure
The unit capstone: learners compute the mean, median, mode, and range of a data set, then choose the measure that best answers a question. They see how an outlier pulls the mean but not the median or mode, and revisit ratios, signed numbers, equations, graphs, and geometry as they summarize real data and defend a choice.
Objectives
Objectives
- D05.S4.06.02 Summarize a data set with mean, median, mode, and range, and choose the measure that best answers a question.
- D05.S4.06.01 Recognize and describe statistical variability, including the center, spread, and shape of a data set.
Essential question
How do I summarize a data set with mean, median, mode, and range, and choose the measure that best answers my question?
Key vocabulary
Materials
Standard materials
- Data summary recording page · 1 per learner A page to compute mean, median, mode, and range for data sets and choose the best measure
- Data set cards · 1 set per group Cards with real data sets (books read, coins saved, rainfall) including one with an outlier
- Counters · 30 per group To find the mean by sharing counters evenly and the median by lining them up
Low-tech / no-cost
- Share and line up Use stones or seeds — share them evenly to find the mean, and line them up to find the middle (median)
- Voice and body Learners line up by height to find the median person, and find the mode by grouping equal values aloud
Enriched / lab & device
- A statistics tool · 1 per group A tool that computes mean, median, mode, and range and shows an outlier's effect, where devices allow
- A real survey task · 1 per group Collect a real data set (a class survey) and write a one-paragraph summary choosing the best measure
Works in different contexts
- large-group Compute the four measures together at the front for one data set, then have pairs summarize card sets and share which measure they chose and why
- multi-age Younger learners find the mode and range while older learners compute the mean and median and argue for the best measure
- self-directed A learner works the recording page alone, computing all four measures and justifying a choice, against the worked example
- level-grouped Learners ready to extend explain how an outlier pulls the mean but not the median or mode, and choose accordingly
- outdoor-only Use found objects (stones, leaves) to share evenly for the mean and line up for the median, then decide the best measure
Lesson 14 — Mean, Median, Mode, and Range: Choosing the Best Measure
Summary
The unit capstone: learners compute the mean, median, mode, and range of a data set, then choose the measure that best answers a question. They see how an outlier pulls the mean but not the median or mode, and revisit ratios, signed numbers, equations, graphs, and geometry as they summarize real data and defend a choice.
Objectives
- Summarize a data set with mean, median, mode, and range, and choose the measure that best answers a question. (D05.S4.06.02)
- Recognize the center, spread, and shape of a data set and explain how an outlier affects each. (D05.S4.06.01)
Connection
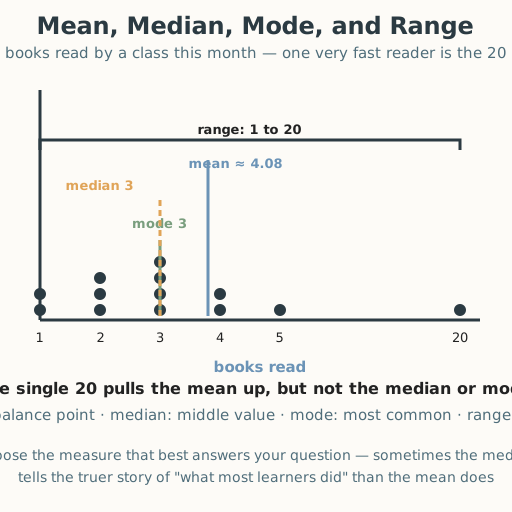
A class records how many books each learner read this month: most read 2, 3, or 4, but one fast reader finished 20. What is “typical”? The mean (about 4.08) gets pulled up by that single 20 and overstates most learners; the median (3) and mode (3) tell the truer story of “what most did.” Choosing the measure that fits your question is real judgment — a nurse reading a growth chart, a market trader reading prices, a planner reading rainfall — and it is the honest way to let data answer, rather than to make data say what you want.
Materials
- Data summary recording page
- Data set cards
- Counters
Preparation
- Copy the data summary recording page and data set cards (include at least one set with an outlier).
- Have a worked example ready: books read 1, 1, 2, 2, 2, 3, 3, 3, 3, 4, 4, 5, 20 → mean ≈ 4.08, median 3, mode 3, range 1 to 20.
Facilitator note
This lesson is written to the learner (“you”). The ideas to land: (1) the mean is the balance point
(sum ÷ count); the median is the middle value in order; the mode is the most common value; the
range is the spread (largest − smallest); and (2) choosing the best measure depends on the question
— the median or mode resists outliers, the mean uses every value. Because this is a capstone of foundational
skills, use explicit instruction and worked examples before independent work (Kirschner, Sweller & Clark,
2006). The classic slip is finding the mean of a data set with an outlier and reporting it as “typical”
without noticing the pull. Retrieval: this lesson is a spiral review — have learners recall the unit’s
ratios, signed numbers, one-step equations, tables and graphs, and area/volume, and notice each one hiding
in the data work (ordering the data uses signed-number order; the mean is a kind of “fair share” ratio;
spread is range). The egalitarian lens is sharp (docs/philosophy.md §4): a single wealthy person can
distort a country’s average income, which is why fair summaries often report the median — choosing the
measure is a question of honesty and fairness, not just arithmetic. Note the global point: “averages” and
middle values appear in ancient record-keeping from Babylon to India; the modern care with outliers is a
refinement of that old habit. Distinguish evidence (the computed measures) from values (which measure is
“fairest” for a purpose).
Procedure
- Gather (5 min). You have spent this unit learning to reason with numbers. Today you put a whole pile of numbers into one honest summary — and choose which number to trust.
- Meet the four measures (10 min). The mean is the balance point: add all the values and divide by how many. The median is the middle value when they are in order. The mode is the value that appears most. The range is the spread: largest minus smallest.
- Worked example — compute (10 min). For the books-read data (1, 1, 2, 2, 2, 3, 3, 3, 3, 4, 4, 5, 20): sum = 53, count = 13, so mean = 53 ÷ 13 ≈ 4.08. Put them in order; the 7th value is median = 3. The mode = 3 (appears most). The range = 20 − 1 = 19.
- Worked example — choose (10 min). The single 20 pulls the mean up to 4.08, but most learners read 3. If your question is “what did a typical learner read?”, the median or mode (3) is the better answer. If your question is “how much reading did the class do in total?”, the mean helps. The best measure depends on the question.
- Practice with a partner (10 min). Take your data set cards. For each, compute all four measures, then say which measure best answers the question and why. Check each other’s arithmetic and reasoning.
- Close (10 min). Summarize the unit aloud: ratios kept shares fair; signed numbers placed things above and below zero; variables and equations found unknowns; tables and graphs showed relationships; area, volume, and nets measured shape; and today’s measures summarize data honestly. Choose the measure that answers your question — that is mathematics in service of truth.
Differentiation
- Support: Use small data sets (5–7 values) with no outlier first; find the mean by physically sharing counters evenly and the median by lining up objects. Read each step aloud so learners with low vision can follow by listening and touch.
- Extension: Given a data set with an outlier, compute all four measures, explain exactly how the outlier affects each, and write a one-paragraph summary defending the best measure for a stated purpose.
Assessment
- Formative/Summative (self/peer): Can the learner compute mean, median, mode, and range and choose the measure that best answers a question, with a reason?
- Self-check: The learner asks, “Did I compute all four measures correctly, and did I choose the measure that fits my question — not just the one I like — and say why?”
Home connection
Collect a small data set at home (daily steps, coins saved, hours of sleep over a week) and find its mean, median, mode, and range; tell someone which measure best describes “typical” and why.
Resources
- Mean, median, mode, and range are standard in middle-grades statistics; see John A. Van de Walle,
Elementary and Middle School Mathematics (10th ed., 2019). The observation that a single outlier
distorts the mean but not the median is a standard statistical fact; the claim that fair summaries often
report the median is an egalitarian value with real policy import (
docs/philosophy.md§4). The note that averages and middle values appear in ancient Babylonian and Indian record-keeping is documented history.