Lesson 13 — Statistical Variability: Center, Spread, and Shape
Learners recognize and describe statistical variability in a data set by its center (where the data piles up), its spread (how far it stretches, from smallest to largest), and its shape (peaks, symmetry, gaps). They build dot plots of real measurements and describe each of the three features.
Objectives
Objectives
- D05.S4.06.01 Recognize and describe statistical variability, including the center, spread, and shape of a data set.
Essential question
How do I describe the variability of a data set by its center, spread, and shape?
Key vocabulary
Materials
Standard materials
- Dot-plot recording page · 1 per learner A page with a blank dot-plot axis to plot a data set and mark center, spread, and shape
- Data cards · 1 set per group Cards each naming a real measurement (daily rainfall, hours of sleep, plant heights) to plot
- Sticky notes or markers · 20 per group To build a dot plot by stacking one mark per data value
Low-tech / no-cost
- A ground or cloth dot plot Lay stones or leaves in columns over values to make a dot plot, then find the center and spread by eye
- Body dot plot Learners stand in columns by their value (how many siblings, hours of sleep) to form a living dot plot
Enriched / lab & device
- A data-visualization tool · 1 per group A tool that builds dot plots and highlights center and spread, where devices allow
- A real measurement task · 1 per group Measure a real varying quantity (leaf lengths, pulse rates) and plot the class data
Works in different contexts
- large-group Build one dot plot together at the front with sticky notes, then have pairs plot a data set and describe it
- multi-age Younger learners place the marks and find the tallest column while older learners describe center, spread, and shape
- self-directed A learner plots a data set alone, marks the center and spread, and describes the shape, checking the worked example
- level-grouped Learners ready to extend compare two data sets' shapes and explain what "more spread out" means in the real situation
- outdoor-only Measure a real varying quantity outdoors (leaf lengths, pebble sizes) and build a dot plot with found objects
Lesson 13 — Statistical Variability: Center, Spread, and Shape
Summary
Learners recognize and describe statistical variability in a data set by its center (where the data piles up), its spread (how far it stretches, from smallest to largest), and its shape (peaks, symmetry, gaps). They build dot plots of real measurements and describe each of the three features.
Objectives
- Recognize and describe the center, spread, and shape of a data set as features of its variability. (D05.S4.06.01)
Connection
Ask ten friends how many hours they slept last night and the answers will not all be the same — some six, some eight, maybe one twelve. That difference is variability, and it is the heart of data: no two days of rain, no two plants, no two people are identical. To make sense of a pile of numbers, you describe three things — where they center, how far they spread, and what shape they make. Weather stations, nurses, farmers, and scientists everywhere read data this way, from a rainfall record in a monsoon village to a growth chart in a clinic.
Materials
- Dot-plot recording page
- Data cards
- Sticky notes or markers
Preparation
- Copy the dot-plot recording page and data cards.
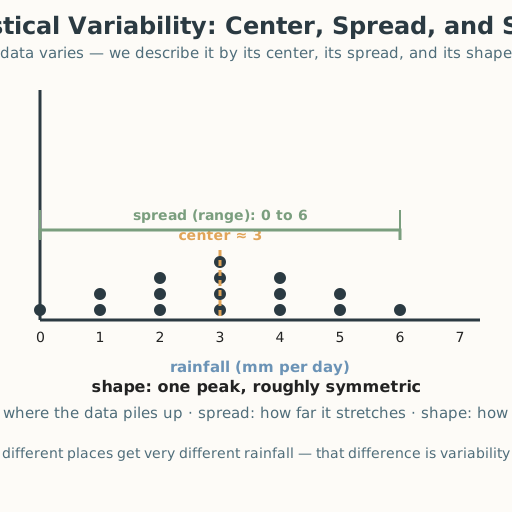
- Have a worked example ready: daily rainfall 0, 1, 1, 2, 2, 2, 3, 3, 3, 3, 4, 4, 4, 5, 5, 6 mm → center ≈ 3, spread 0 to 6, shape roughly symmetric with one peak.
Facilitator note
This lesson is written to the learner (“you”). The ideas to land: (1) variability means the data are
not all the same — that difference is what statistics studies; (2) we describe a data set by its center
(where it piles up), its spread (the range from smallest to largest), and its shape (peaks,
symmetry or skew, gaps); and (3) a dot plot makes all three visible. Model a worked example first, then
guide a second before independent work (Kirschner, Sweller & Clark, 2006). A common slip is reporting only
one number (usually the biggest) and missing the spread — variability is the whole point. Retrieval: ask
learners to recall ordering signed numbers (finding smallest and largest) — that skill now feeds “spread.”
The critical-thinking lens is central (docs/philosophy.md §7): one number never tells the whole story of
a data set; describing center and spread and shape is the honest way to summarize. Note the global
point: recording and reading variability — rainfall, harvest, river height — is an ancient human practice
in every farming and fishing culture, long before “statistics” had a name.
Procedure
- Gather (5 min). Think of the last ten days’ weather. Were they all the same, or did they vary? Today you learn to describe that “varying” with three words.
- Meet variability (10 min). Variability means the data are not all the same. A dot plot stacks one dot over each value so you can see the differences at a glance.
- Worked example — build the plot (10 min). Plot the rainfall data: put one dot over 0, two over 1, three over 2, four over 3, three over 4, two over 5, one over 6. Now the shape is visible.
- Worked example — describe it (10 min). Name the three features. Center: where the dots pile up — around 3 mm. Spread: from the smallest (0) to the largest (6) — a range of 0 to 6. Shape: one peak, roughly even on both sides (symmetric), no big gaps.
- Practice with a partner (10 min). Take your data cards and build each dot plot with sticky notes. Describe its center, spread, and shape in one sentence each. Check each other: did you name all three?
- Close (5 min). Data vary, and that variety is the story. Center says where, spread says how far, shape says how — three words that turn a pile of numbers into a picture.
Differentiation
- Support: Use small data sets (8–10 values) with a pre-drawn axis; describe each feature aloud and use tactile marks (pebbles) so learners with low vision can feel the columns.
- Extension: Compare two data sets’ shapes and explain which is more spread out and what that means in the real situation; identify a gap or an unusual peak.
Assessment
- Formative (observation/self): Can the learner build a dot plot and describe its center, spread, and shape accurately?
- Self-check: The learner asks, “Did I name where the data centers, how far it spreads, and what shape it makes — all three, not just one number?”
Home connection
Collect a small real data set at home (heights of plants, lengths of leaves, hours slept over a week), make a dot plot, and describe its center, spread, and shape.
Resources
- Describing variability by center, spread, and shape is standard in middle-grades statistics; see John A.
Van de Walle, Elementary and Middle School Mathematics (10th ed., 2019). The note that recording and
reading variability (rainfall, harvest, river height) is an ancient practice in farming and fishing
cultures is a historical observation; the value that one number never tells the whole story is a
critical-thinking commitment (
docs/philosophy.md§7).