Lesson 14 — The Normal Distribution and Standard Deviation
Learners meet the mean and standard deviation as a two-number summary of center and spread, the normal distribution (bell curve) and the empirical rule, and use z-scores to spot variability and outliers. They read the bell curve's history critically — data describes a population, but there is no "normal person."
Objectives
Objectives
- D05.S4.11.01 Use the normal distribution and standard deviation to describe data and reason about variability and outliers.
Essential question
How does the normal distribution and standard deviation describe how data spread out, and how do I spot variability and outliers?
Key vocabulary
Materials
Standard materials
- Data problem sheet · 1 per learner Worked and practice problems for mean, standard deviation, z-scores, and outliers
- Math journal · 1 per learner
- A real data set (heights, rainfall, prices) · 1 per group
Low-tech / no-cost
- A pile of pebbles or seeds of varied sizes Sort them by size, find the middle and the spread, and spot the odd ones out (outliers)
- Chalk and a wall or ground Draw a histogram of a real measurement to see the bell shape and its spread
Enriched / lab & device
- Calculator or spreadsheet · 1 per learner or pair To compute mean, standard deviation, and z-scores quickly
Works in different contexts
- large-group Build one bell curve whole-class from real data, then learners compute the standard deviation of a small set in pairs
- multi-age Younger learners find the middle and the spread of a small set; older learners compute the standard deviation and z-scores
- self-directed A learner follows the worked examples, then computes the practice set and checks that the standard deviation makes sense
- level-grouped Group by comfort with averages; a ready group uses z-scores to compare values across different scales
- outdoor-only Measure a real quantity (leaf lengths, stone sizes) across a sample, then mark its center and spread on the ground
Lesson 14 — The Normal Distribution and Standard Deviation
Summary
Learners meet the mean (center) and standard deviation (spread) as a two-number summary of a data set, the normal distribution (bell curve) and its empirical rule (about 68–95–99.7%), and use z-scores to spot variability and outliers. They read the bell curve’s history critically: data describes a population, but there is no single “normal person.”
Objectives
- Use the mean, standard deviation, and normal distribution to describe data and reason about variability and outliers. (D05.S4.11.01)
Connection
Pick any measurement of a big group — people’s heights, a month’s rainfall, the price of rice in a market — and most values cluster near the middle, with fewer and fewer far out on either side. The bell curve is the shape of that clustering, and the standard deviation is the ruler that says how spread out the values are. “Within one standard deviation of the mean” is just a precise way of saying “the usual range.”
Materials
- Data problem sheet
- A real data set (heights, rainfall, prices)
- Math journal
Preparation
- Copy or draw the problem sheet.
- Retrieval: from Grade 10, mean and spread (D05.S4.09.01). Today we add the standard deviation and the bell curve.
- Prepare a real data set and worked examples.
Facilitator note
This lesson is written to the learner (“you”). The ideas to land: the standard deviation measures typical distance from the mean; in a normal distribution about 68% of values fall within 1 SD, 95% within 2, and 99.7% within 3; a z-score is how many SDs a value is from the mean, and values beyond ±3 SDs are often flagged as outliers. Teach the compute → place → flag loop explicitly, with worked examples and guided practice (S-011).
The intellectual lens: two numbers (mean, SD) compress a whole data set into a readable shape. The ethics lens: the bell curve was once misused to rank people and call some “normal” and others not — Quetelet’s “average man” became a tool for judging individuals (S-429); we teach the tool and reject that misuse. W. E. B. Du Bois answered that misuse with data of his own: his 1900 Data Portraits used statistics and color to show the full humanity and progress of Black America, turning numbers from a ranking into a tool for justice (S-432). The egalitarianism lens: data describes a distribution, never a person’s worth — there is no “normal person,” and an outlier is information, not a verdict. The critical-thinking lens: learners ask what the spread means before trusting an average, and check whether a value is truly unusual or just expected variability. Distinguish the mathematics (the curve) from the value (that no person is a deviation from a norm). Preview: Lessons 15–16 design and critique surveys and experiments.
Procedure
- Recall (5 min). From Grade 10, what is the mean? Today we add a measure of spread.
- Mean and standard deviation (15 min). The standard deviation (SD) is the typical distance of values from the mean. Worked example: 2, 4, 4, 4, 5, 5, 7, 9 has mean 5; the SD is about 2. A small SD means the values hug the mean; a large SD means they fan out.
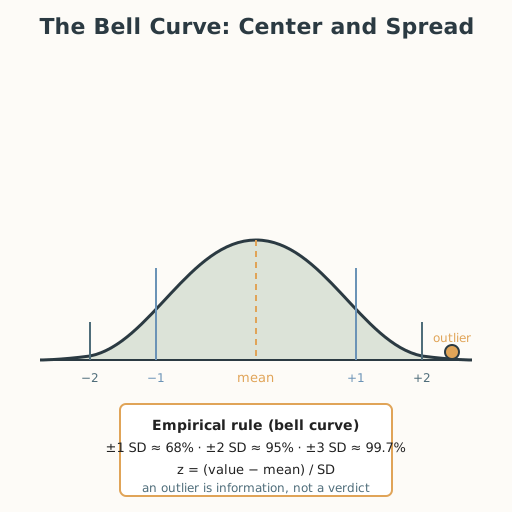
- The bell curve and the empirical rule (12 min). Many real measurements form a normal distribution — a bell curve. The empirical rule: about 68% of values are within 1 SD of the mean, 95% within 2 SD, 99.7% within 3 SD. Worked example: heights with mean 165 cm and SD 6 cm → about 68% of people are 159–171 cm, and about 95% are 153–177 cm.
- Z-scores and outliers (10 min). A z-score = (value − mean)/SD tells how many SDs a value sits from the mean. A value with |z| > 3 is often flagged as an outlier — worth a second look, not an automatic error. Worked example: a height of 186 cm with mean 165, SD 6 → z = (186 − 165)/6 = 3.5, unusually tall.
- Guided practice (10 min). With a partner: (a) compute the mean and SD of a small set; (b) state the range that holds 95% of a bell-curve population; (c) find the z-score of an unusual value and say whether it is an outlier.
- Close (3 min). Say what the SD tells you that the mean alone cannot, and why an outlier is information, not a verdict.
Differentiation
- Support: Compute the mean only first, then add the SD with a step-by-step worked example on a small whole-number set (a calculator may speed this up, but it is never required — the pebbles-and-spread path from Materials also lands the idea with no arithmetic at all).
- Extension: Compare two data sets with different means using z-scores, and explain why a raw score alone is misleading.
Assessment
- Formative (peer + self): Can the learner compute a mean and standard deviation, apply the empirical rule, and use a z-score to identify an outlier?
- Portfolio artifact (unit): The data sheet with the outlier judgment, added to the data toolkit.
Home connection
Measure one thing across your household or neighborhood (heights, shoe sizes, the number of steps to a door). Find the middle and the spread, and name any outlier you see.
Resources
- On worked examples and guided practice: Kirschner, Sweller & Clark (2006), https://doi.org/10.1207/s15326985ep4102_1 (S-011).
- On the bell curve’s history and its misuse to rank people: Boyer & Merzbach, A History of Mathematics (S-429); on data used for justice rather than ranking: W. E. B. Du Bois’s Data Portraits (S-432).